Full Report
The numbers behind PayPal Holdings, Inc.: as-reported financial statements and company metrics for FY2021–FY2025, traced to the source filings, opened with the share-price history those statements have to justify. Every linked figure opens the exact page of the filing it was printed on, with the statement row highlighted. Amounts in US$ millions unless noted.
Reading notes: Every annual column is cited to that fiscal year's own Form 10-K, as originally reported. Later 10-Ks reclassified several lines (see discrepancies); using own-year figures keeps each citation on the page that first printed the number. Revenue breakdown uses PayPal's Note 3 disaggregation by category (transaction revenues vs revenues from other value added services), which is reported consistently across all five years. PayPal also disaggregates revenue by geography (U.S. vs other countries); that cut is not charted here because the presentation changed (the U.K. was broken out through FY2022 and folded into 'other countries' thereafter). The SEC XBRL feed returned null net revenues for FY2020–FY2025; revenue was taken directly from the filings. FY2016–FY2020 long-term-record figures are from the standardized data feed (SEC XBRL) and carry no page links; FY2019–FY2020 also appear as comparative columns in the FY2021 10-K. FY2020 operating cash flow in the feed (6,219) reflects the later reclassified basis (the FY2021 10-K as-originally-reported figure was 5,854).
Share Price — Full Available History — 11 Years
The stock closed at $56.15 on Jul 24, 2026 — up 53% over the window shown (+3.9% a year), trading between $30.63 and $308.53.
Source: market price feed, weekly closes, sampled from 2,781 source observations, Jul 2015–Jul 2026. Price return only, excludes dividends.
Market capitalization $68.4bn and enterprise value $70.3bn.
Market cap = 1.22B shares outstanding × the Jul 24, 2026 close of $56.15. Enterprise value adds total debt of $10.0bn and subtracts cash and equivalents of $8.0bn (net debt of $1.9bn), from the FY2025 balance sheet. Market-derived figures, shown without filing links.
FY2025 at a Glance
Revenue (US$ millions)
Operating income (US$ millions)
Net income (US$ millions)
Source: FY2025 consolidated statements [1] [2] [3] [4]. Click any linked figure to open the filing page with the row highlighted.
Net Revenues by Category
| Net Revenues by Category | FY2021 | FY2022 | FY2023 | FY2024 | FY2025 |
|---|---|---|---|---|---|
| Transaction revenues | 23,402 | 25,206 | 26,857 | 28,842 | 29,798 |
| Revenues from other value added services | 1,969 | 2,312 | 2,914 | 2,955 | 3,374 |
| Total net revenues | 25,371 | 27,518 | 29,771 | 31,797 | 33,172 |
| Total net revenues growth, derived | — | +8.5% | +8.2% | +6.8% | +4.3% |
Source: Note 3, Revenue — Disaggregation of Revenue (Form 10-K) [5] [6] [7] [8]. Click any linked figure to open the filing page with the row highlighted.
Income Statement
Source: Consolidated Statements of Income (Loss) [1] [2] [3] [4]. Click any linked figure to open the filing page with the row highlighted.
Columns marked E are consensus analyst estimates from S&P Capital IQ (CapIQ), shown alongside reported results for direct comparison; they are not company guidance.
Estimate source: S&P Capital IQ (CapIQ) consensus, as of 2026-07-25. Estimate figures are S&P Capital IQ consensus (vendor data — no filing page links). EPS and net income use the normalized (adjusted) consensus where the street reports it. Line-item analyst models (segments, drivers, KPIs) are in the Visible Alpha tab.
Balance Sheet
Source: Consolidated Balance Sheets (as originally reported each year) [9] [10] [11] [12]. Click any linked figure to open the filing page with the row highlighted.
Cash Flow
Source: Consolidated Statements of Cash Flows [13] [14] [15] [16]. Click any linked figure to open the filing page with the row highlighted.
Platform Engagement Reach
| Platform Engagement Reach | FY2021 | FY2022 | FY2023 | FY2024 | FY2025 |
|---|---|---|---|---|---|
| Payment transactions per active account (TTM) | 45.4 | 51.4 | 58.7 | 60.6 | 57.7 |
| Percent of cross-border TPV | 16.0% | 13.0% | 12.0% | 12.0% | 12.0% |
| Percent of TPV generated outside the U.S. | — | — | 36.0% | 37.0% | 37.0% |
Source: company filings [17] [18] [19] [20]. Click any linked figure to open the filing page with the row highlighted.
Consumer Merchant Credit Book
| Consumer Merchant Credit Book | FY2021 | FY2022 | FY2023 | FY2024 | FY2025 |
|---|---|---|---|---|---|
| Net charge-offs on loans receivable | — | — | 549 | 372 | 328 |
| Consumer loans net charge-off rate (Q4, annualized) | — | — | — | 4.5% | 4.0% |
| Merchant loans net charge-off rate (Q4, annualized) | — | — | — | 5.3% | 7.3% |
| Consumer loans 90 days past due | — | — | — | 1.6% | 1.4% |
| Merchant loans 90 days past due | — | — | — | 2.8% | 3.5% |
Source: company filings [21] [22]. Click any linked figure to open the filing page with the row highlighted.
Non-Cash Charges Tax
| Non-Cash Charges Tax | FY2021 | FY2022 | FY2023 | FY2024 | FY2025 |
|---|---|---|---|---|---|
| Stock-based compensation | 1,376 | 1,261 | 1,475 | 1,230 | 1,002 |
| Depreciation and amortization | 1,265 | 1,317 | 1,072 | 1,032 | 963 |
| Effective income tax rate | (2.0%) | 28.0% | 22.0% | 22.0% | 17.0% |
Source: company filings [13] [23] [14] [24]. Click any linked figure to open the filing page with the row highlighted.
Long-Term Record
| Fiscal year | Total revenue | Operating income | Net income | Diluted earnings per share | Operating cash flow |
|---|---|---|---|---|---|
| FY2016 | 10,842 | 1,586 | 1,401 | 1.15 | 3,158 |
| FY2017 | 13,094 | 2,127 | 1,795 | 1.47 | 2,531 |
| FY2018 | 15,451 | 2,194 | 2,057 | 1.71 | 5,480 |
| FY2019 | 17,772 | 2,719 | 2,459 | 2.07 | 4,071 |
| FY2020 | 21,454 | 3,289 | 4,202 | 3.54 | 6,219 |
| FY2021 | 25,371 | 4,262 | 4,169 | 3.52 | 6,340 |
| FY2022 | 27,518 | 3,837 | 2,419 | 2.09 | 5,813 |
| FY2023 | 29,771 | 5,028 | 4,246 | 3.84 | 4,843 |
| FY2024 | 31,797 | 5,325 | 4,147 | 3.99 | 7,450 |
| FY2025 | 33,172 | 6,065 | 5,233 | 5.41 | 6,416 |
Source: consolidated statements across filings; older years from the standardized feed [13] [1] [14] [2]. Click any linked figure to open the filing page with the row highlighted.
Operating KPIs
| KPI | FY2021 | FY2022 | FY2023 | FY2024 | FY2025 |
|---|---|---|---|---|---|
| Total payment volume | 1,250,000 | 1,360,000 | 1,530,000 | 1,680,000 | 1,790,000 |
| Active accounts | 426,000,000 | 435,000,000 | 426,000,000 | 434,000,000 | 439,000,000 |
| Number of payment transactions | 19,300,000,000 | 22,300,000,000 | 25,000,000,000 | 26,300,000,000 | 25,400,000,000 |
Source: company-reported operating metrics [17] [18] [19] [20]. Click any linked figure to open the filing page with the row highlighted.
Analyst Consensus
Mean target
Median target
High target
Low target
Street ratings: 6 strong buy, 2 buy, 32 hold, 3 strong sell. Consensus: Hold.
Estimate source: S&P Capital IQ (CapIQ) consensus, as of 2026-07-25. Estimate figures are S&P Capital IQ consensus (vendor data — no filing page links). EPS and net income use the normalized (adjusted) consensus where the street reports it. Line-item analyst models (segments, drivers, KPIs) are in the Visible Alpha tab.
Traceability
319 of 344 figures on this page (93%) link to the filing page where they are printed — click a linked figure to open the source PDF at that page with the row highlighted. Unlinked figures come from standardized data feeds or pre-filing years.
Every annual column is cited to that fiscal year's own Form 10-K, as originally reported. Later 10-Ks reclassified several lines (see discrepancies); using own-year figures keeps each citation on the page that first printed the number.
Revenue breakdown uses PayPal's Note 3 disaggregation by category (transaction revenues vs revenues from other value added services), which is reported consistently across all five years. PayPal also disaggregates revenue by geography (U.S. vs other countries); that cut is not charted here because the presentation changed (the U.K. was broken out through FY2022 and folded into 'other countries' thereafter).
The SEC XBRL feed returned null net revenues for FY2020–FY2025; revenue was taken directly from the filings.
FY2016–FY2020 long-term-record figures are from the standardized data feed (SEC XBRL) and carry no page links; FY2019–FY2020 also appear as comparative columns in the FY2021 10-K. FY2020 operating cash flow in the feed (6,219) reflects the later reclassified basis (the FY2021 10-K as-originally-reported figure was 5,854).
Total payment volume (TPV) is displayed in US$ millions (e.g. 1,790,000 = $1.79 trillion); the FY2022 TPV citation lands on the Item 1 financial-highlights graphic because the MD A metrics page rendered the figure as an image.
PayPal initiated a quarterly cash dividend in FY2025 (130 paid); no dividends were paid FY2021–FY2024, so those cells are blank.
Balance-sheet FY2024 comparative figures in the FY2025 and FY2026 filings (total assets 78,725) differ from the FY2024 10-K as-originally-reported (81,611) due to a prepaid/other-current-assets reclassification — see discrepancies.
4 figure(s) differed between the data feed and the filing; the filing value is shown (see the run's metrics/metrics_tab.json for the audit trail).
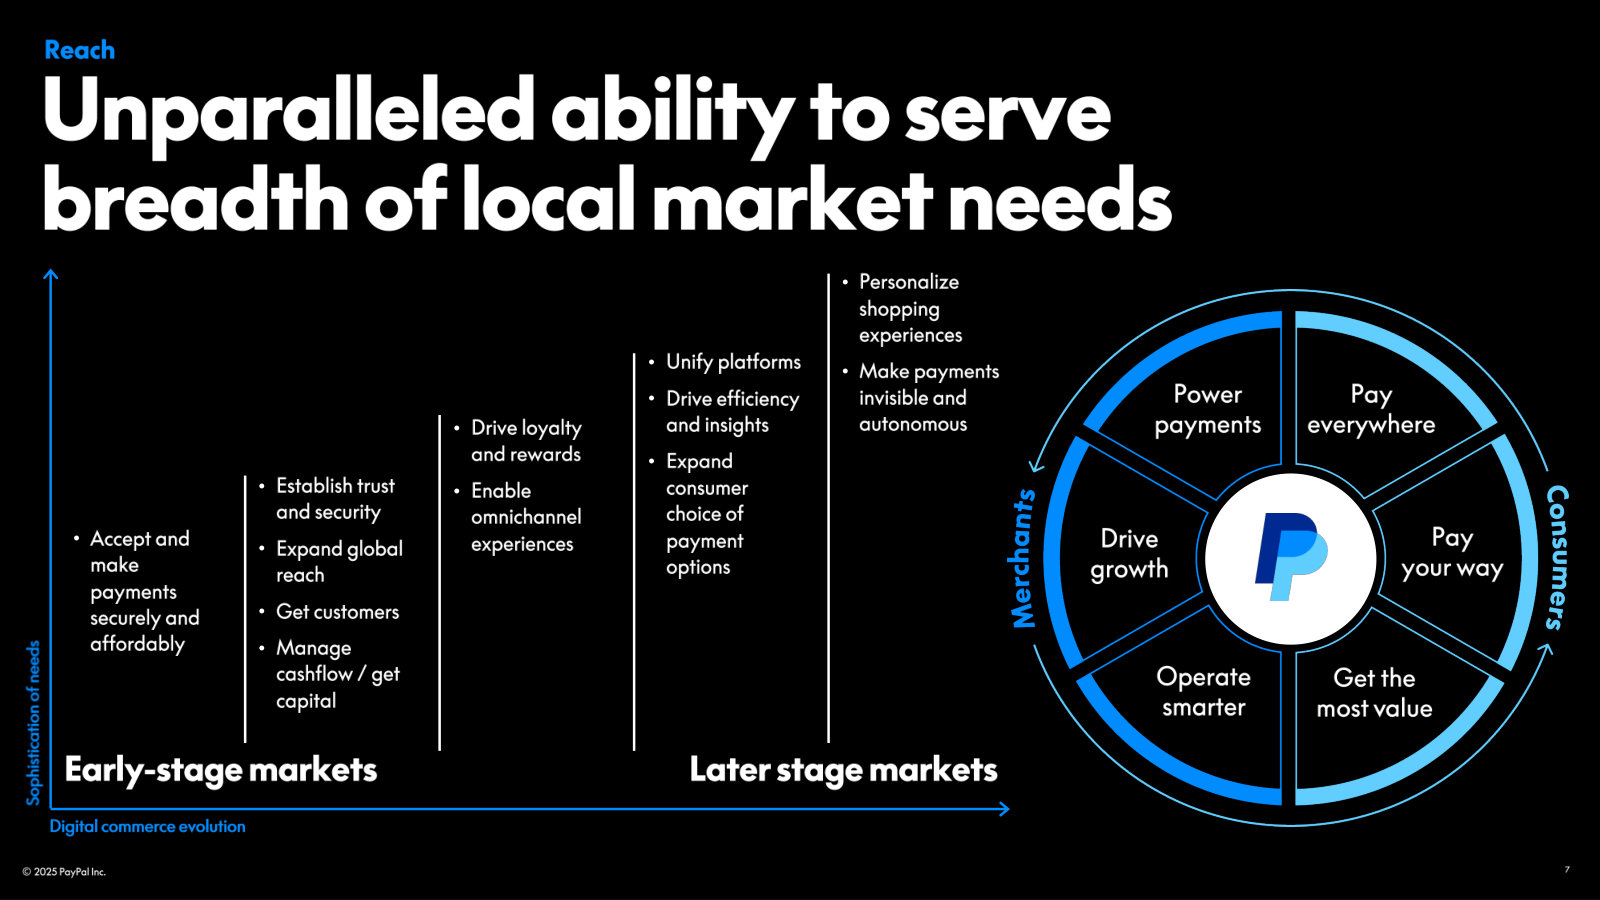
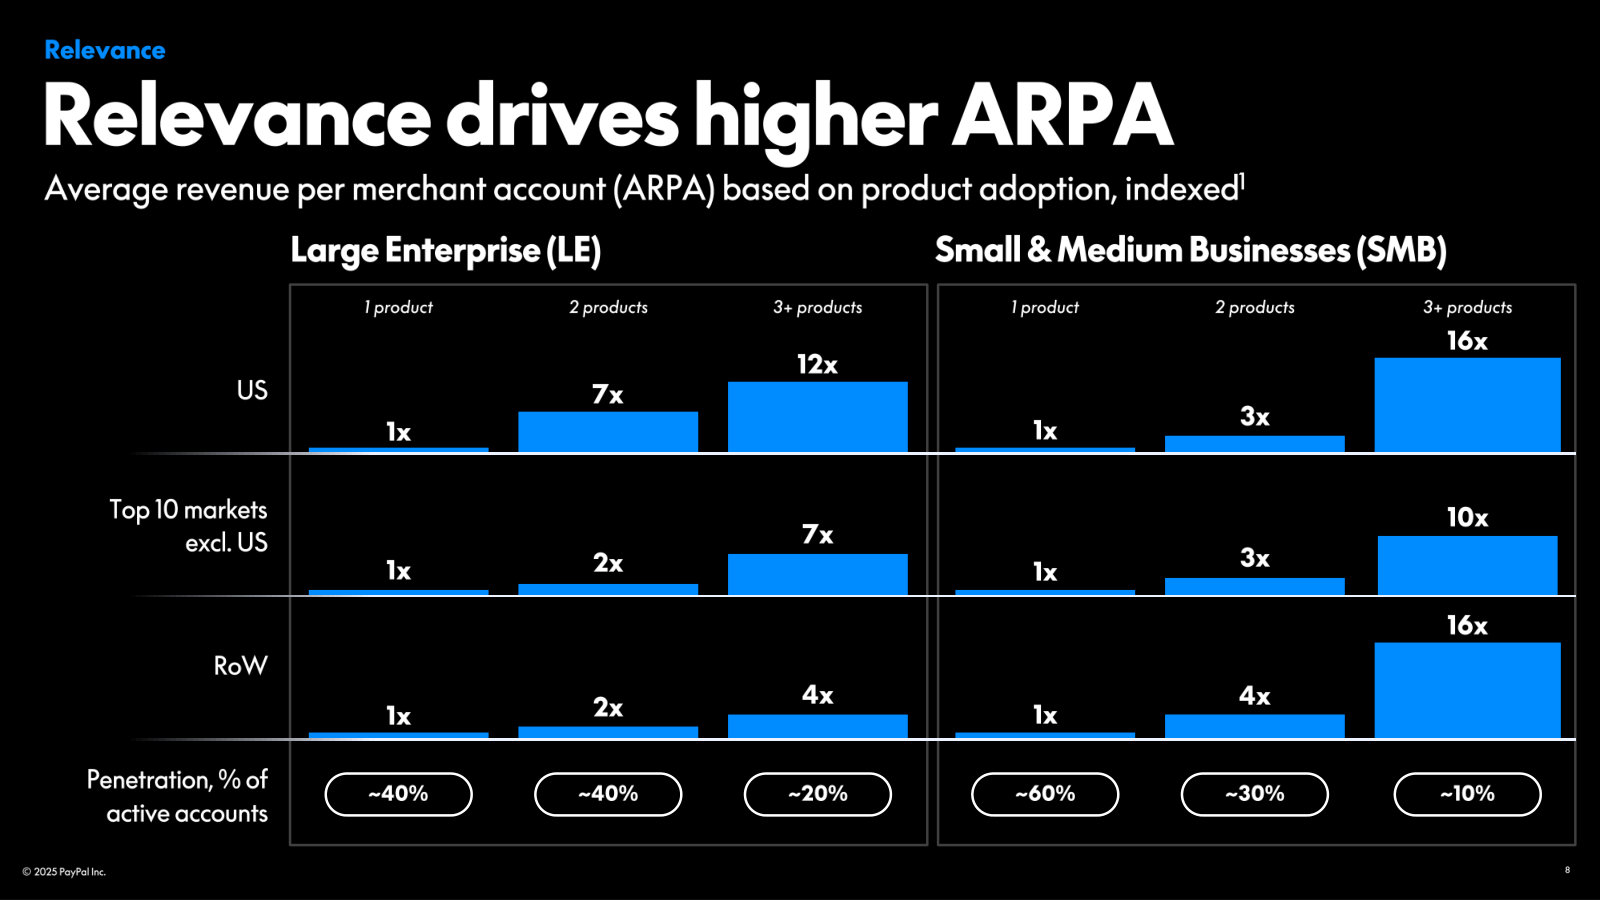
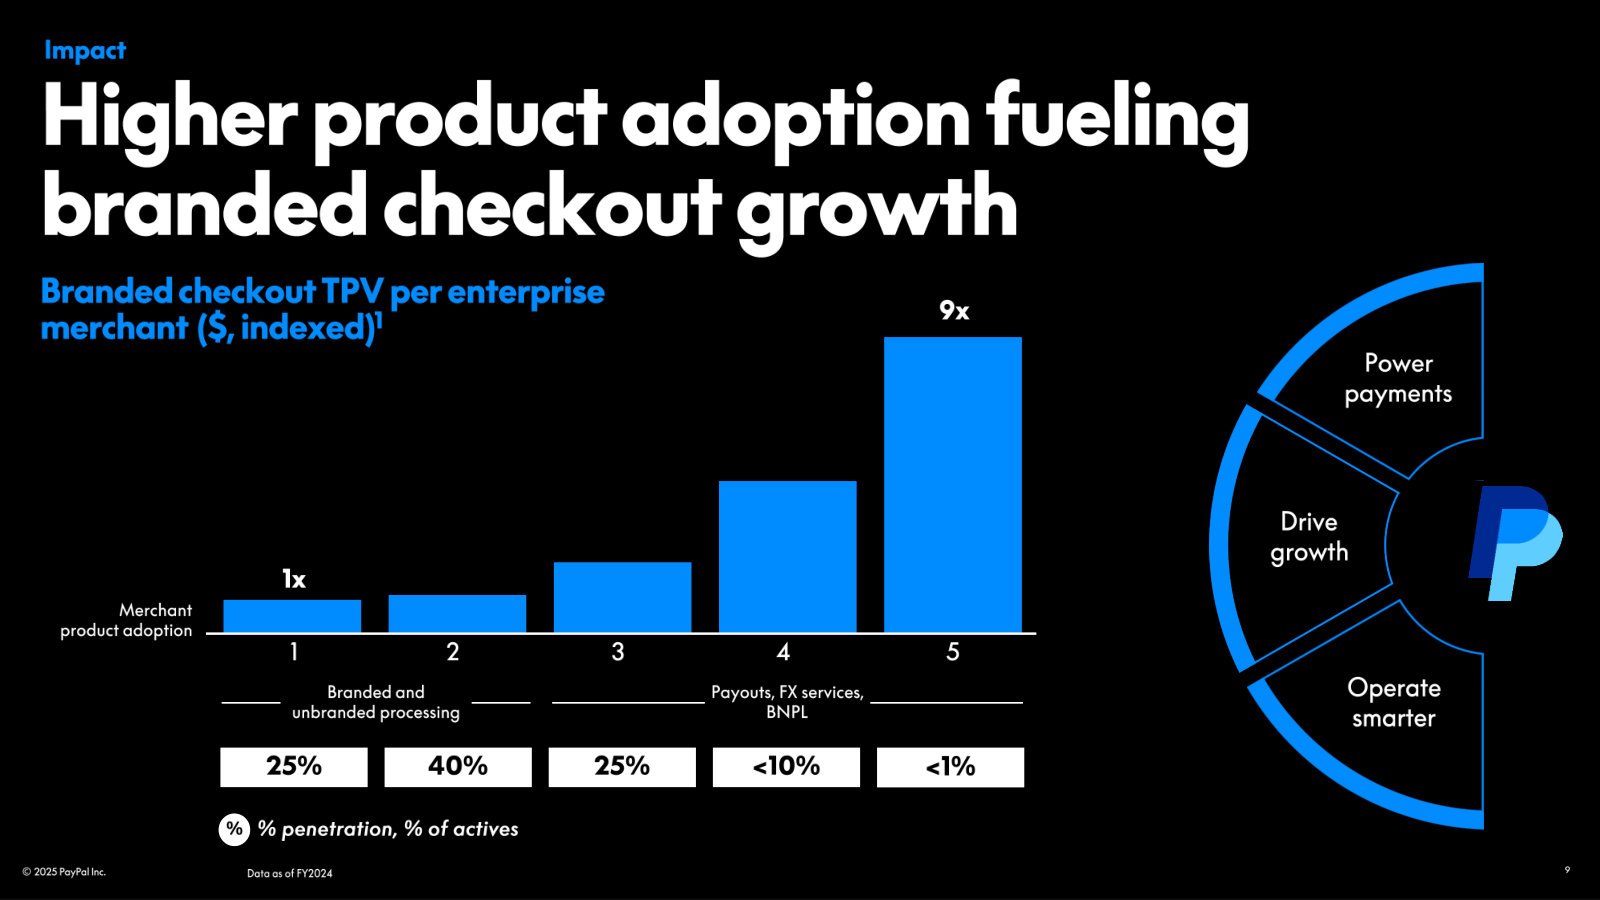
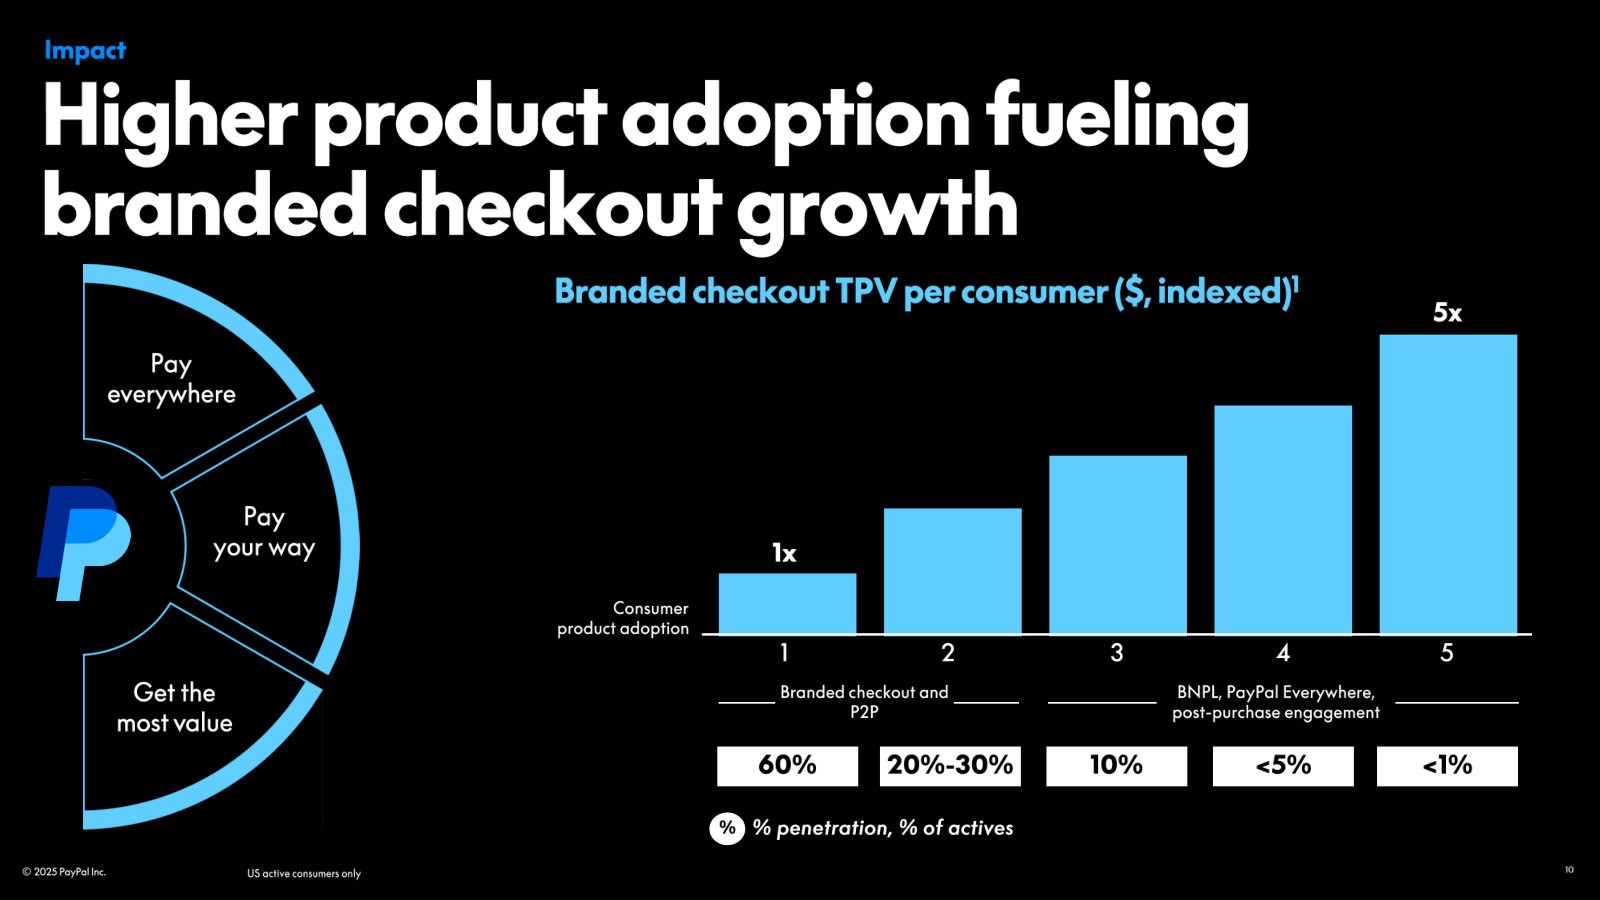
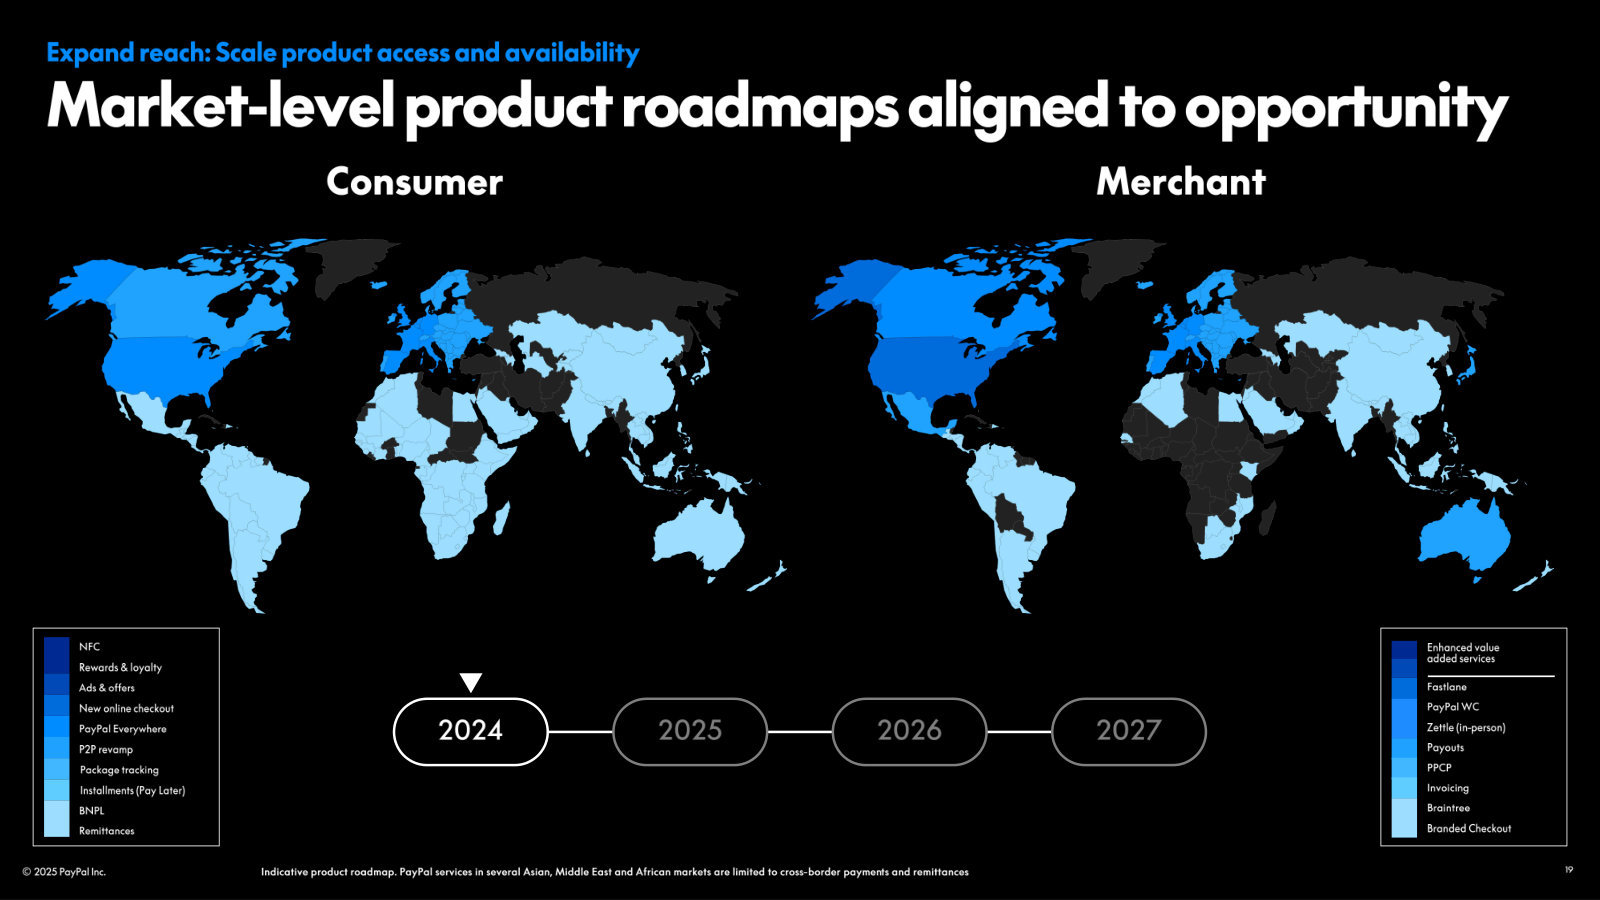
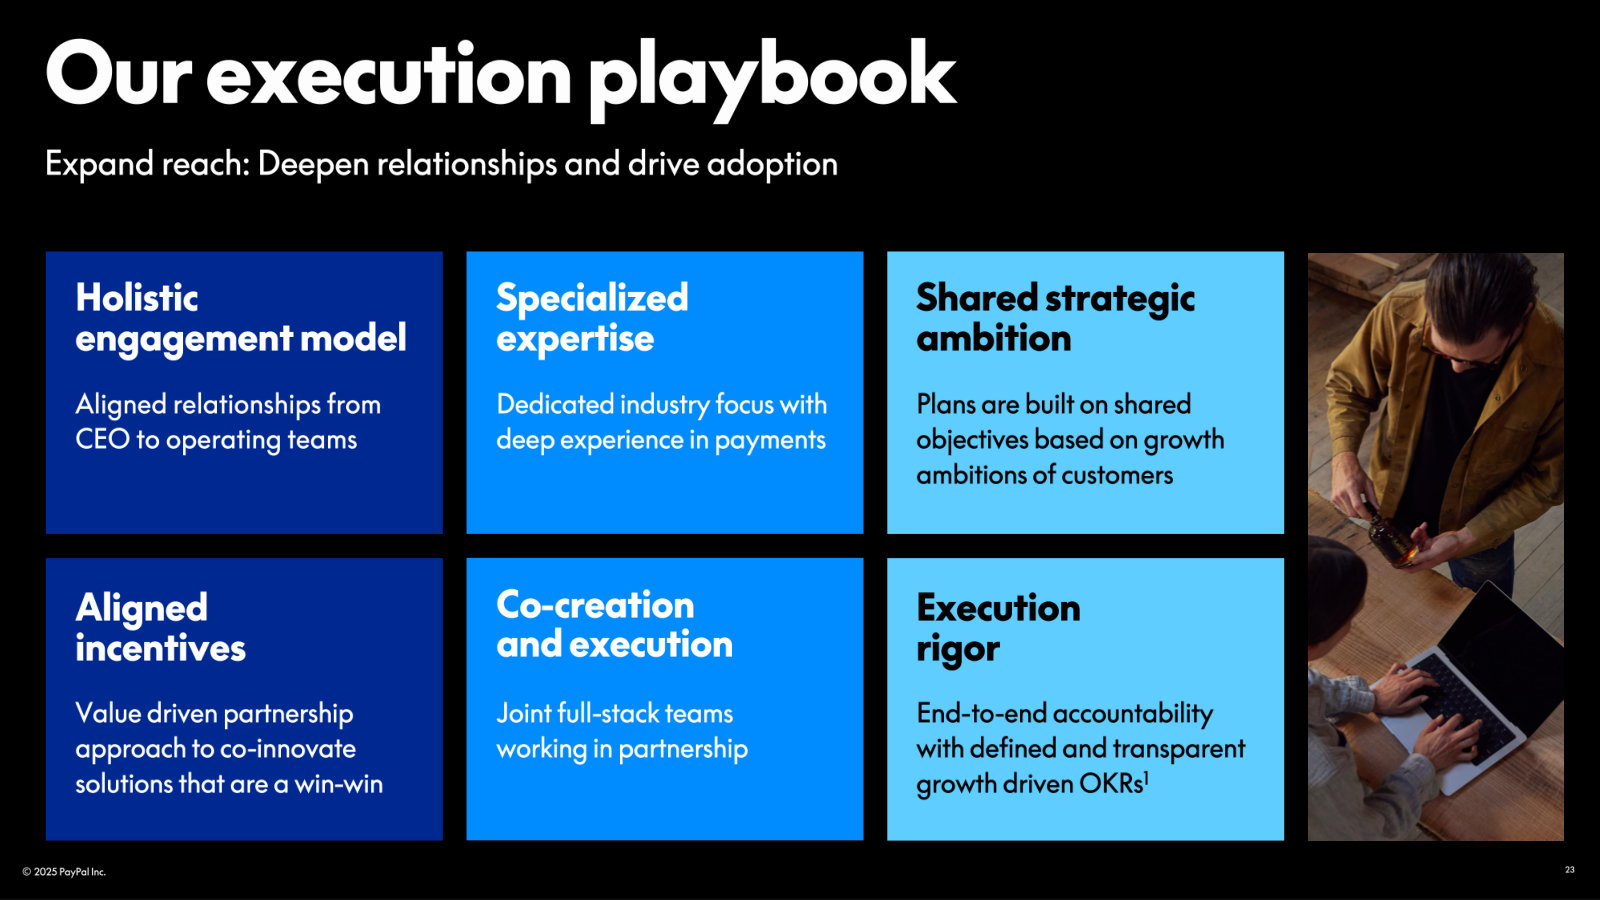
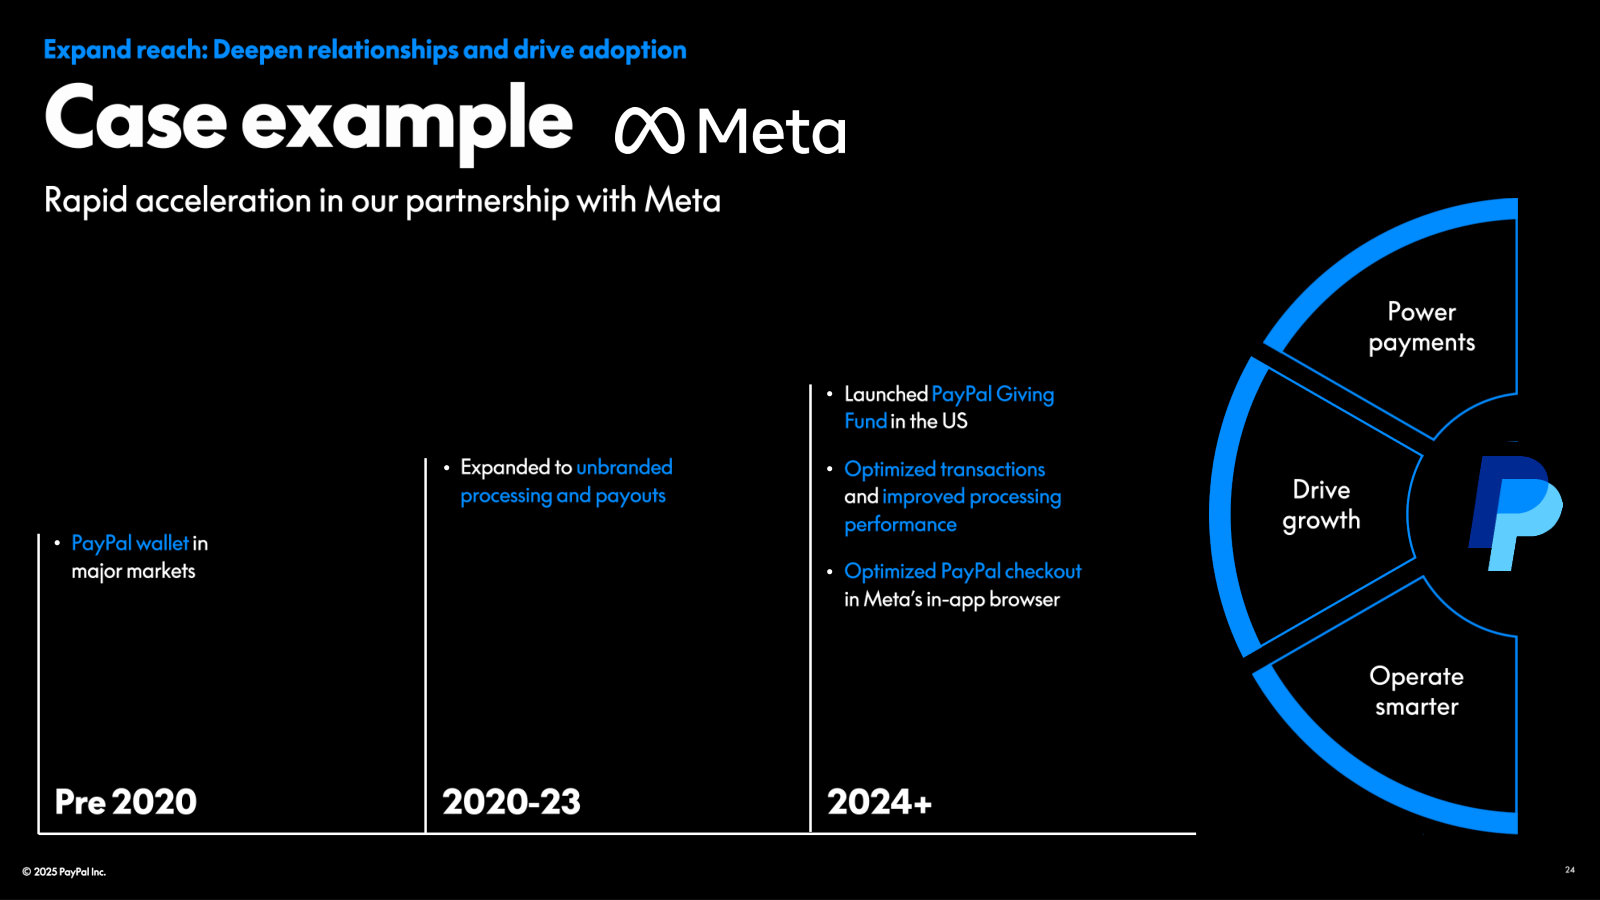
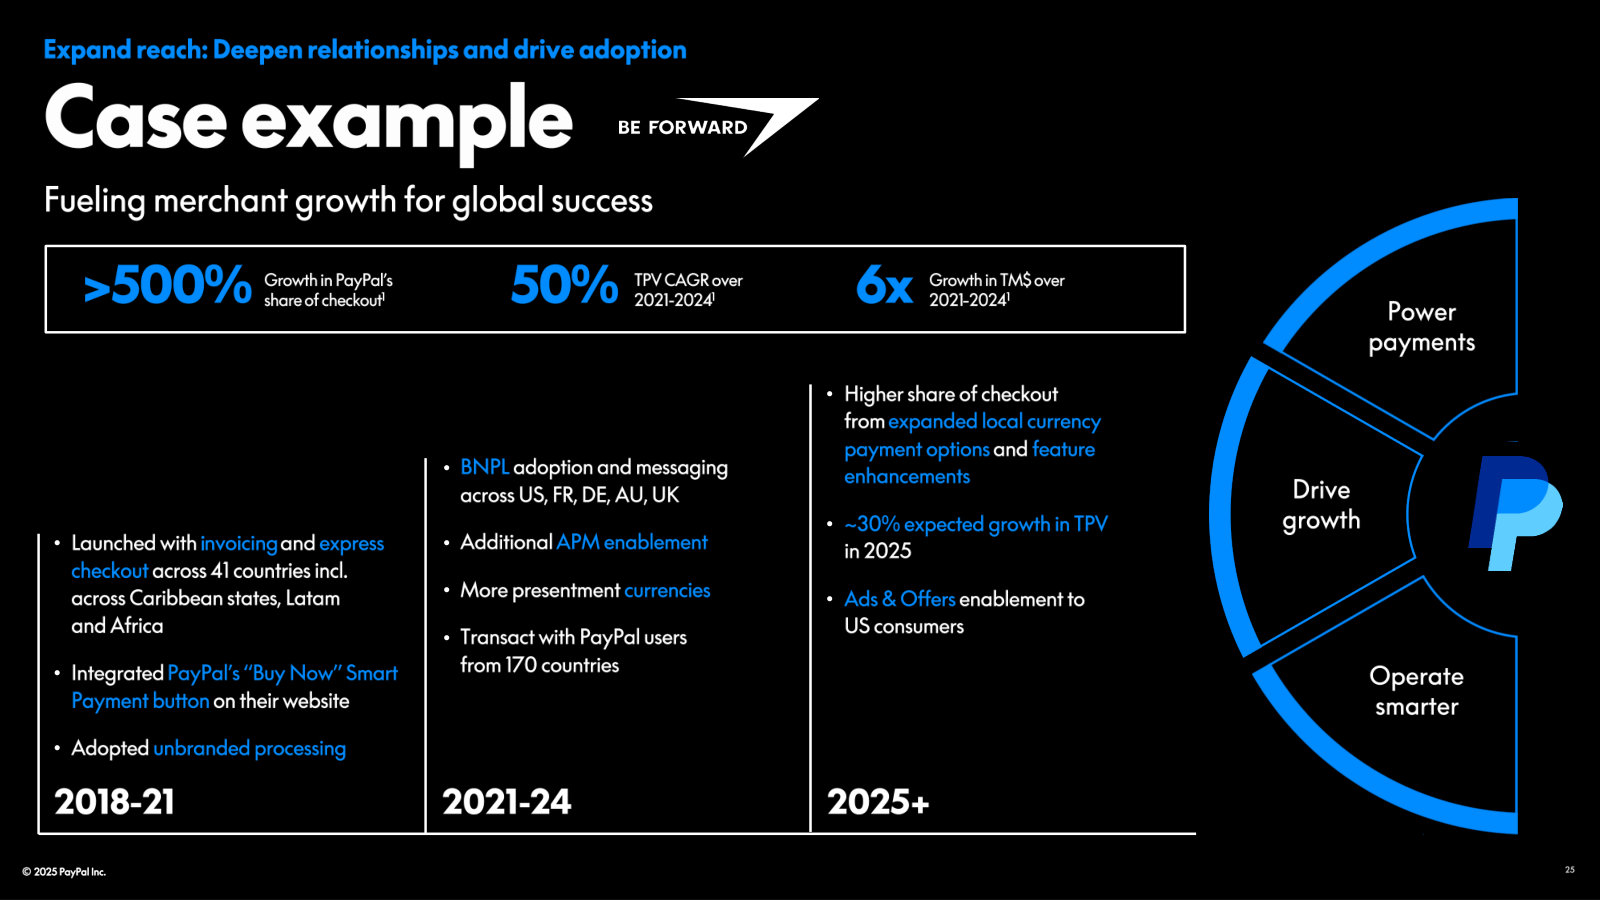
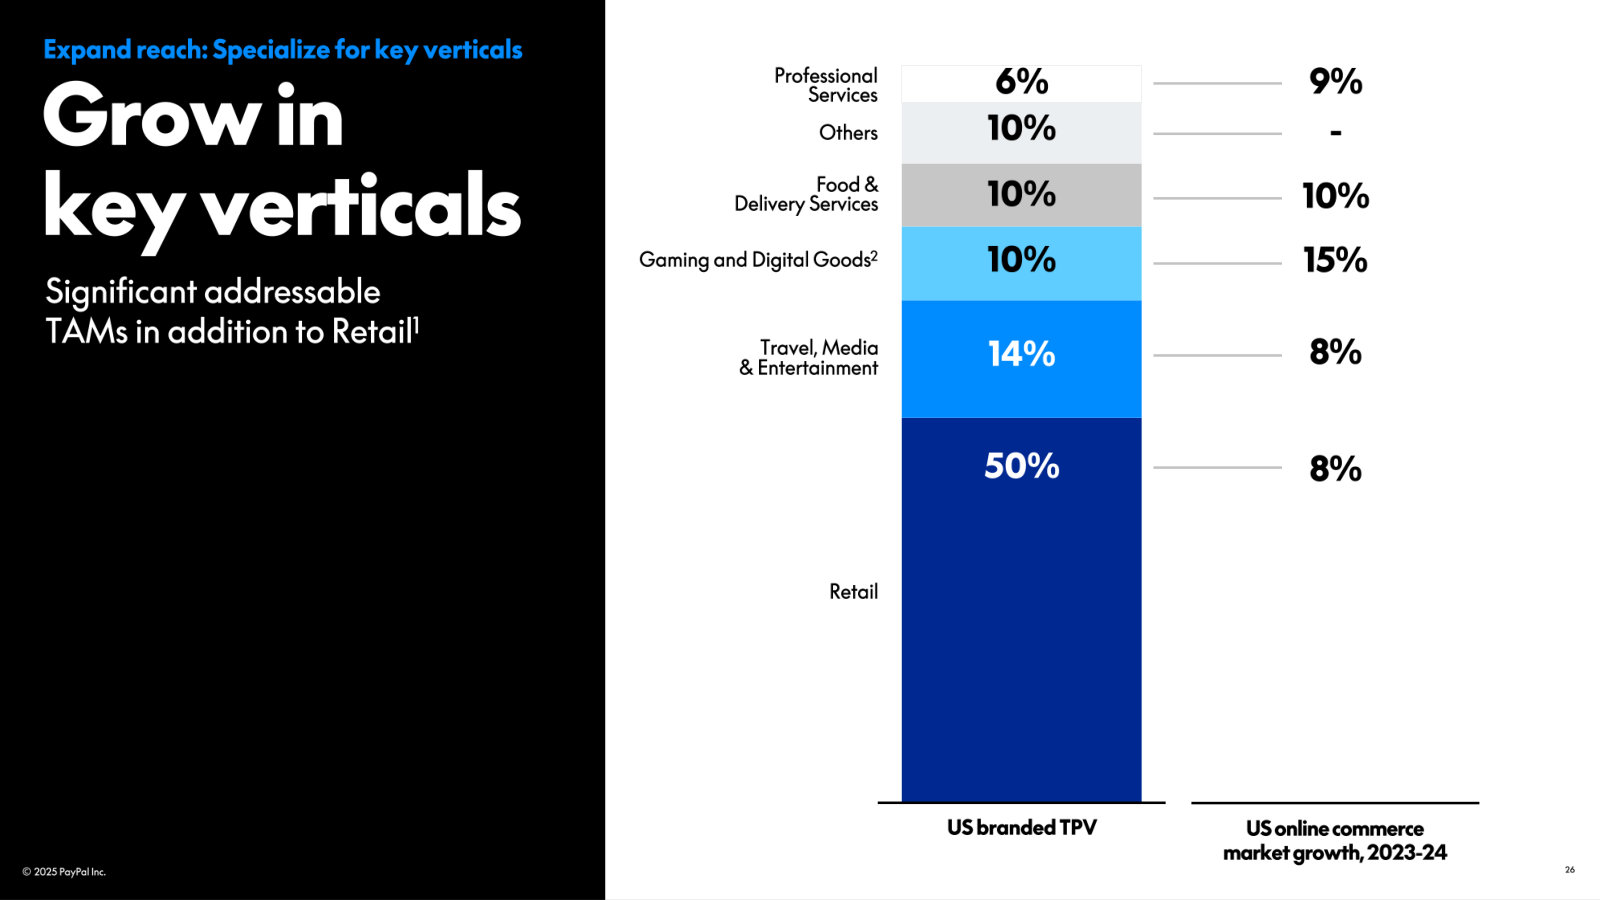
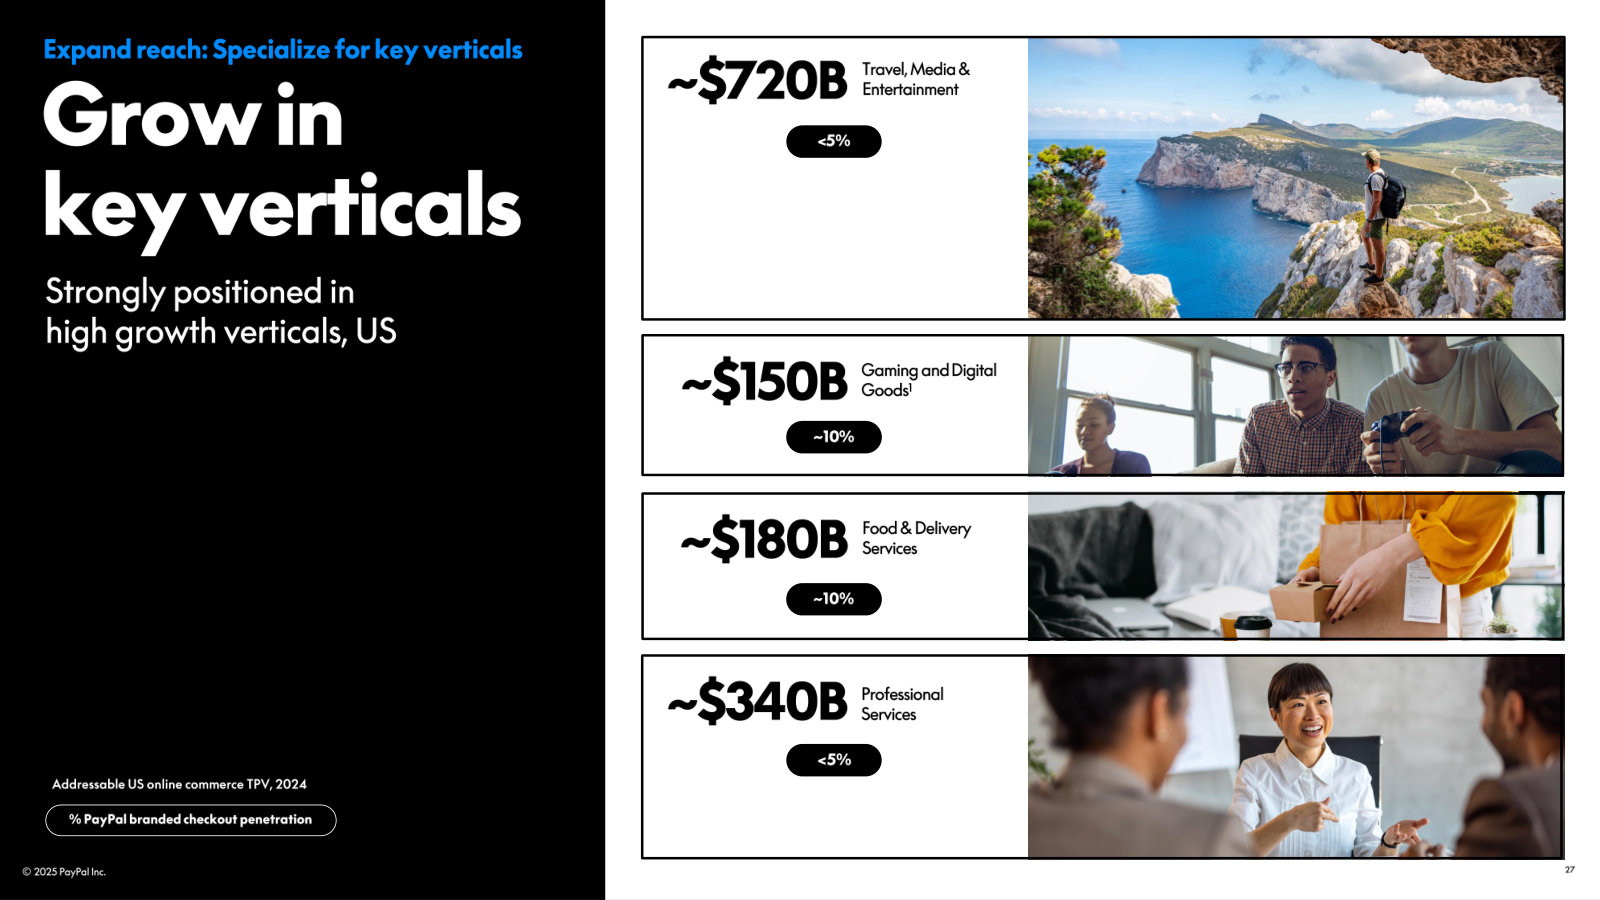
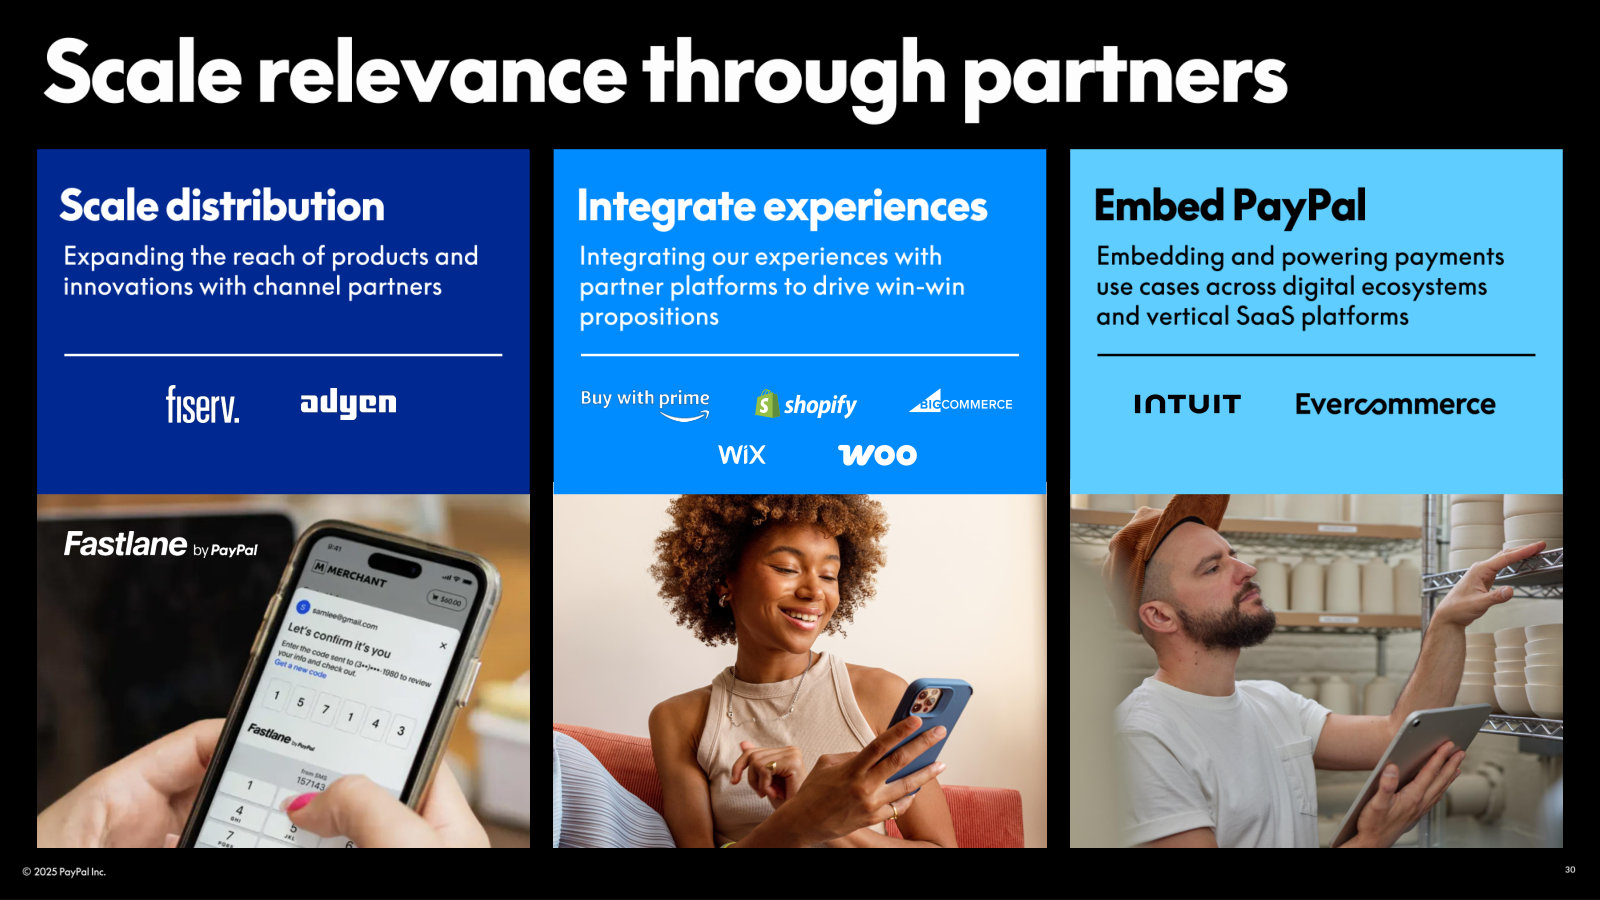
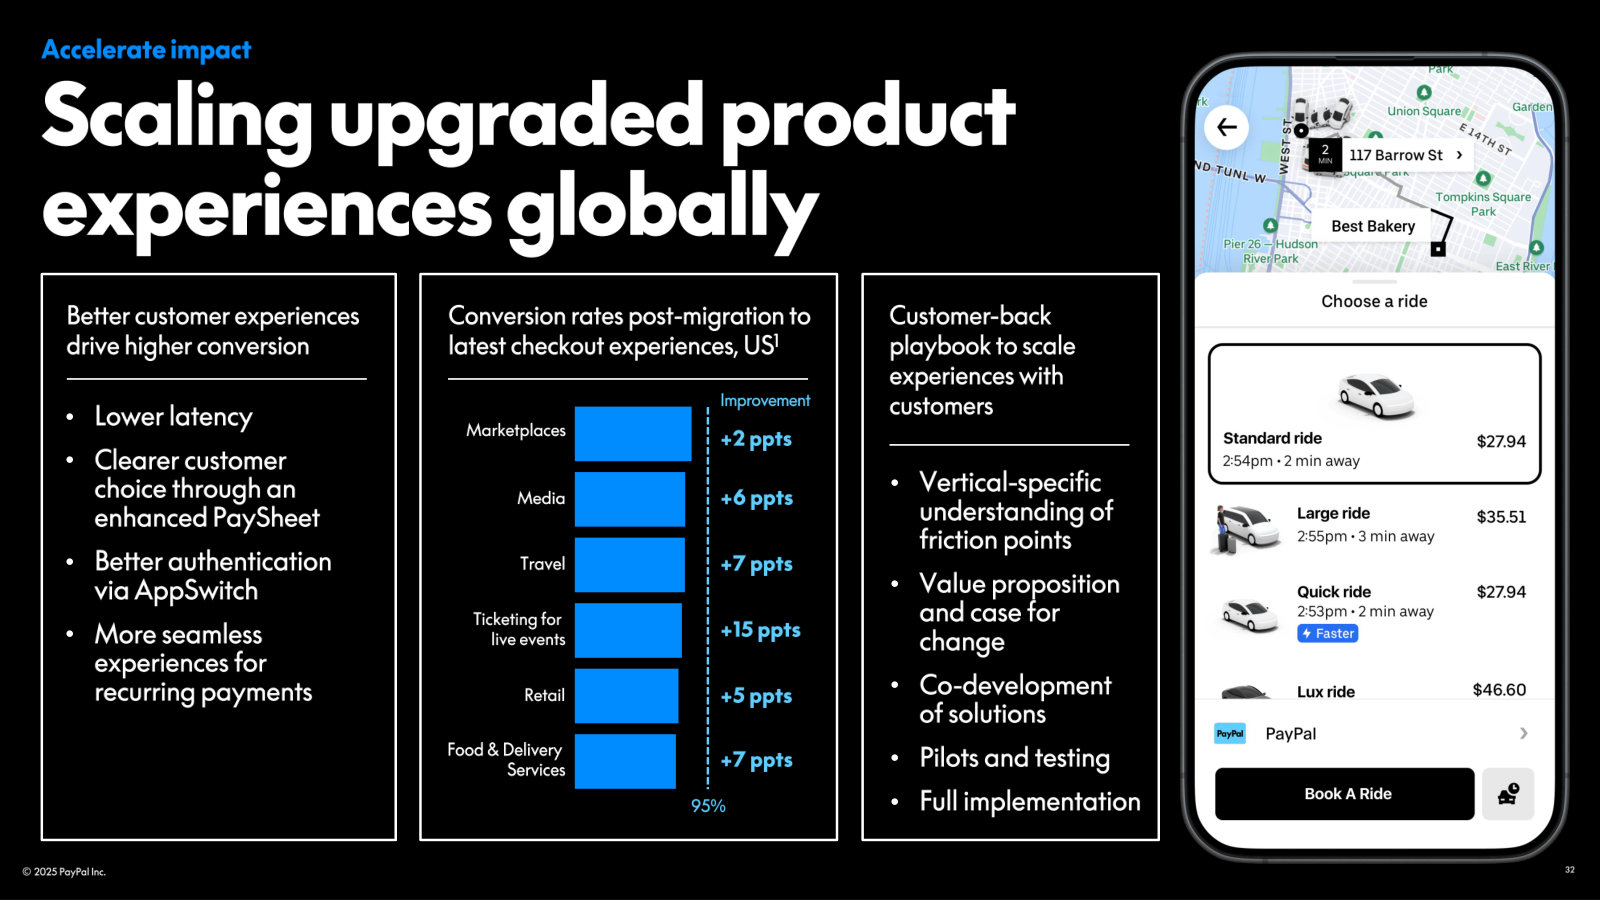
PayPal Holdings, Inc.'s management explains the business in its own materials. The slides below do the most of that work, pulled from the documents preserved in Sources. Each source link opens the complete presentation at that slide in a new tab.
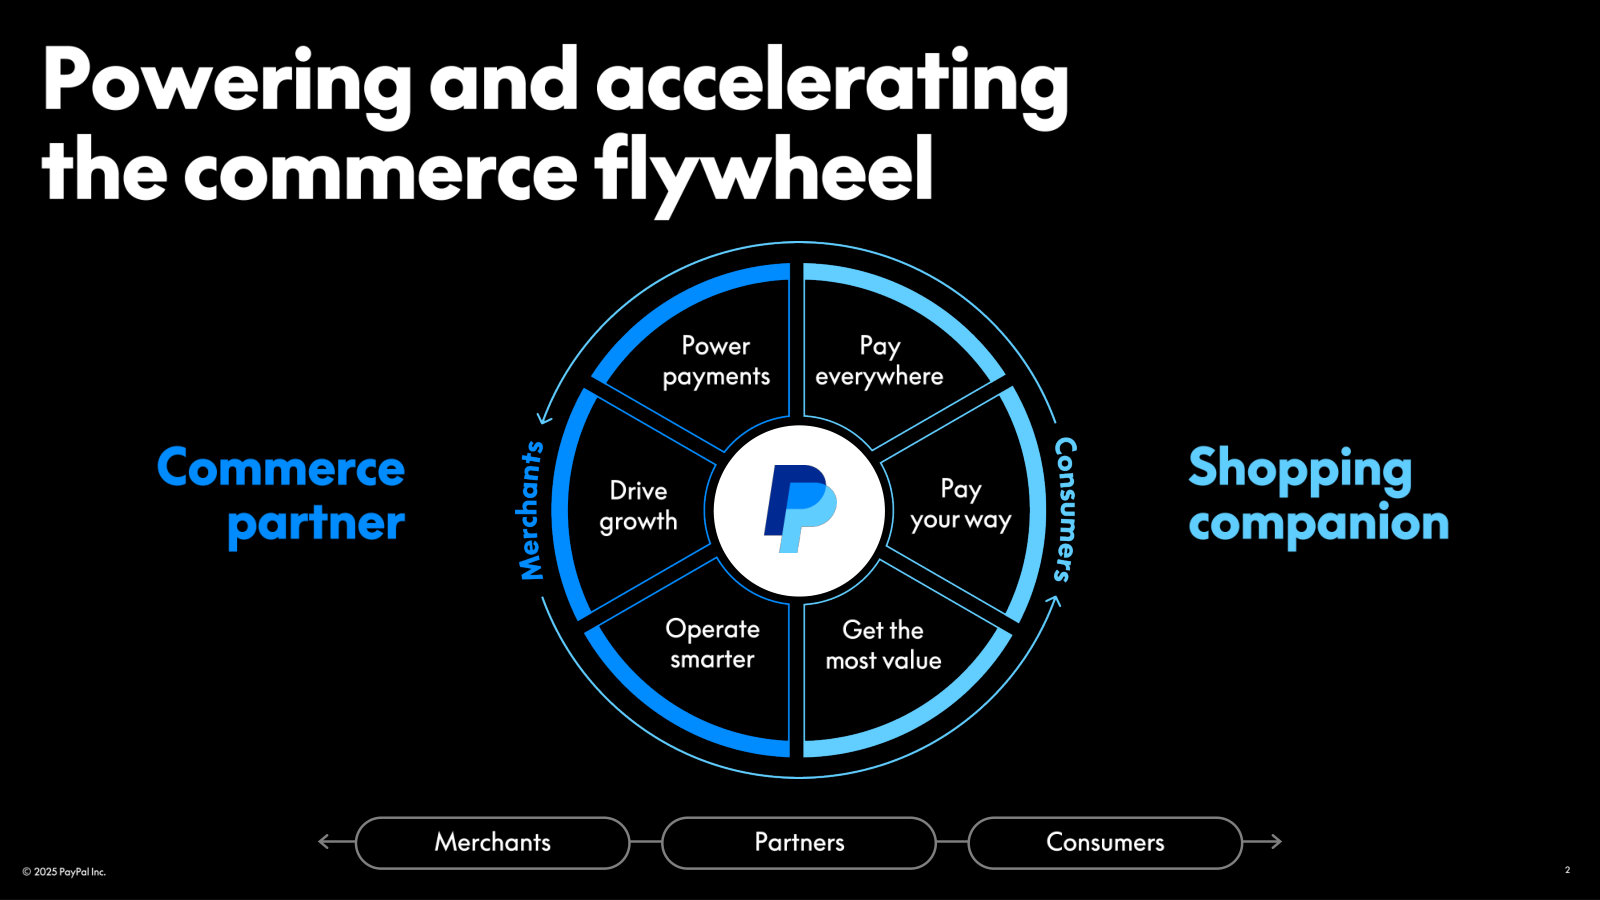
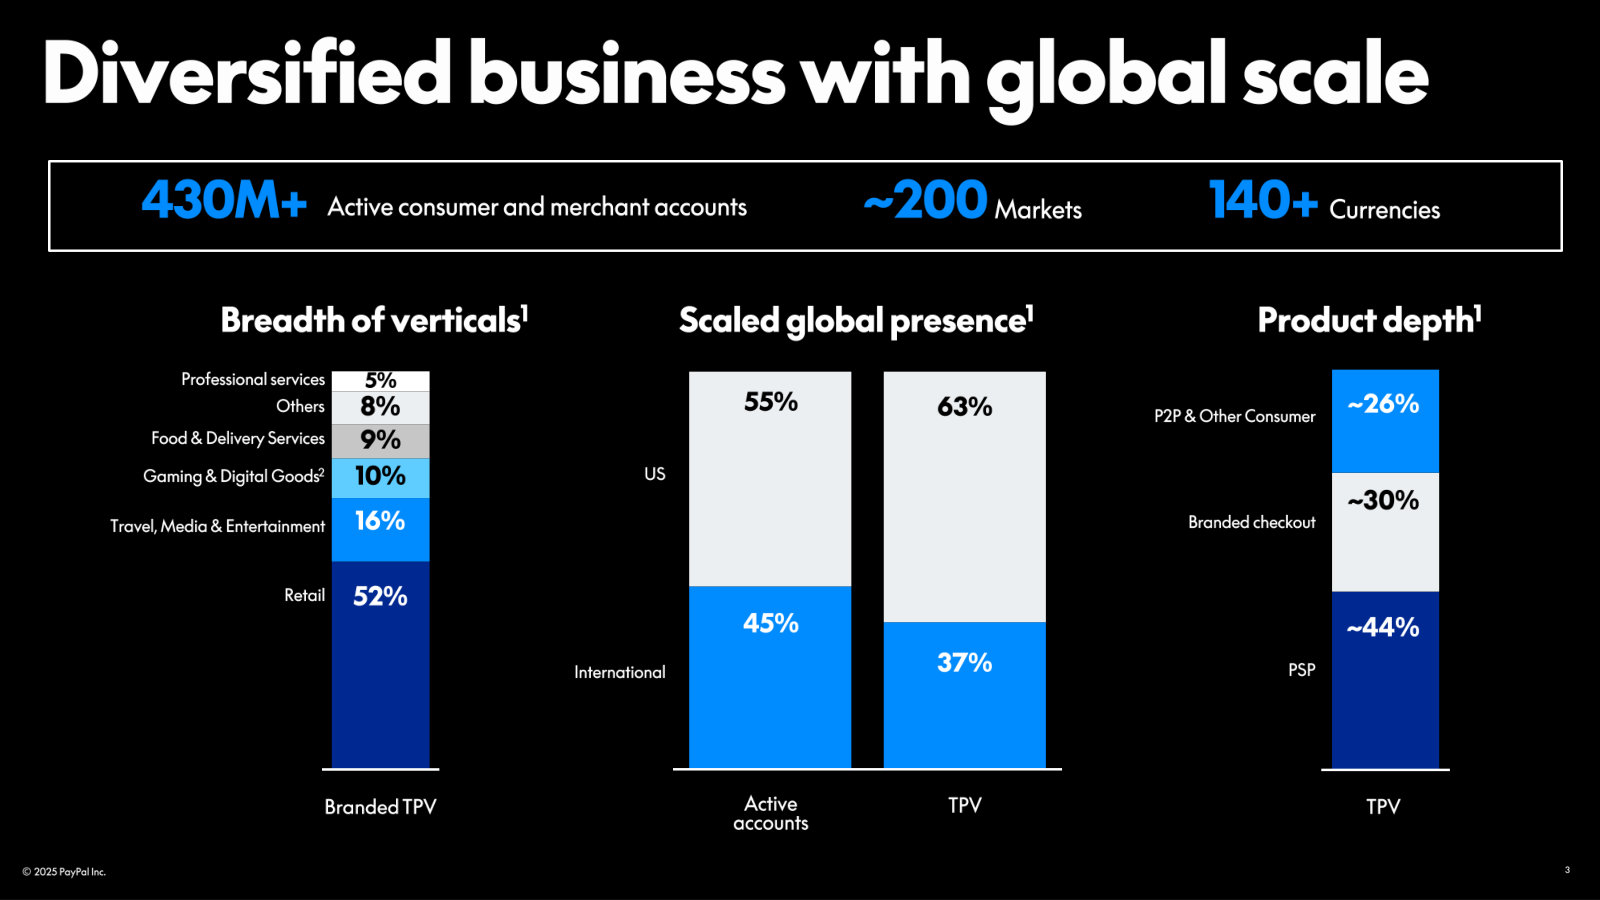
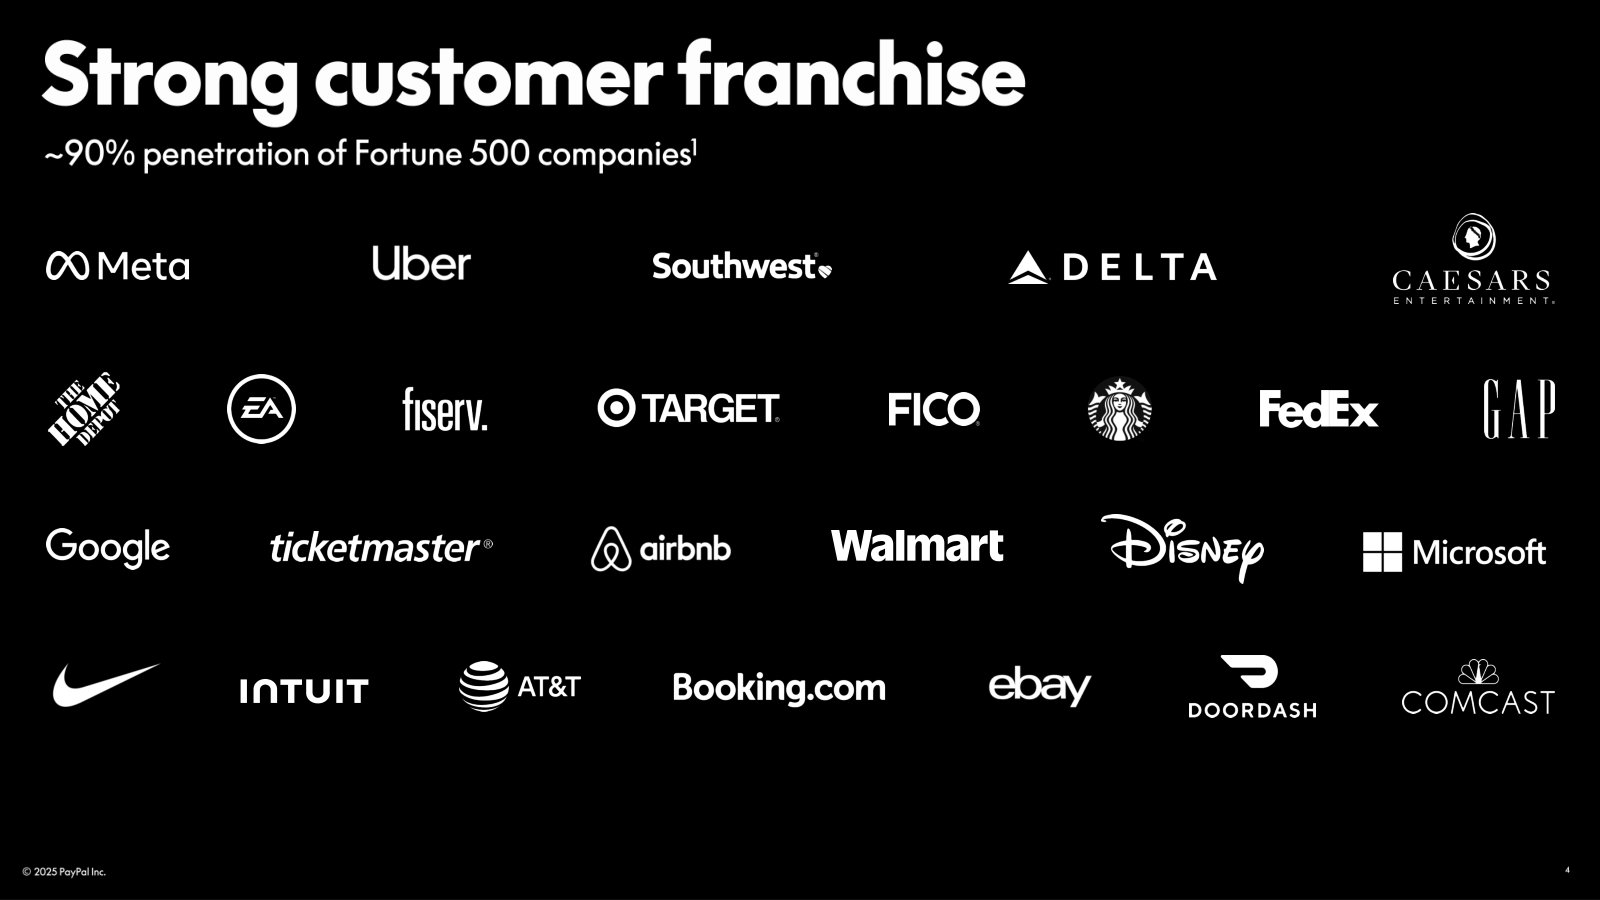
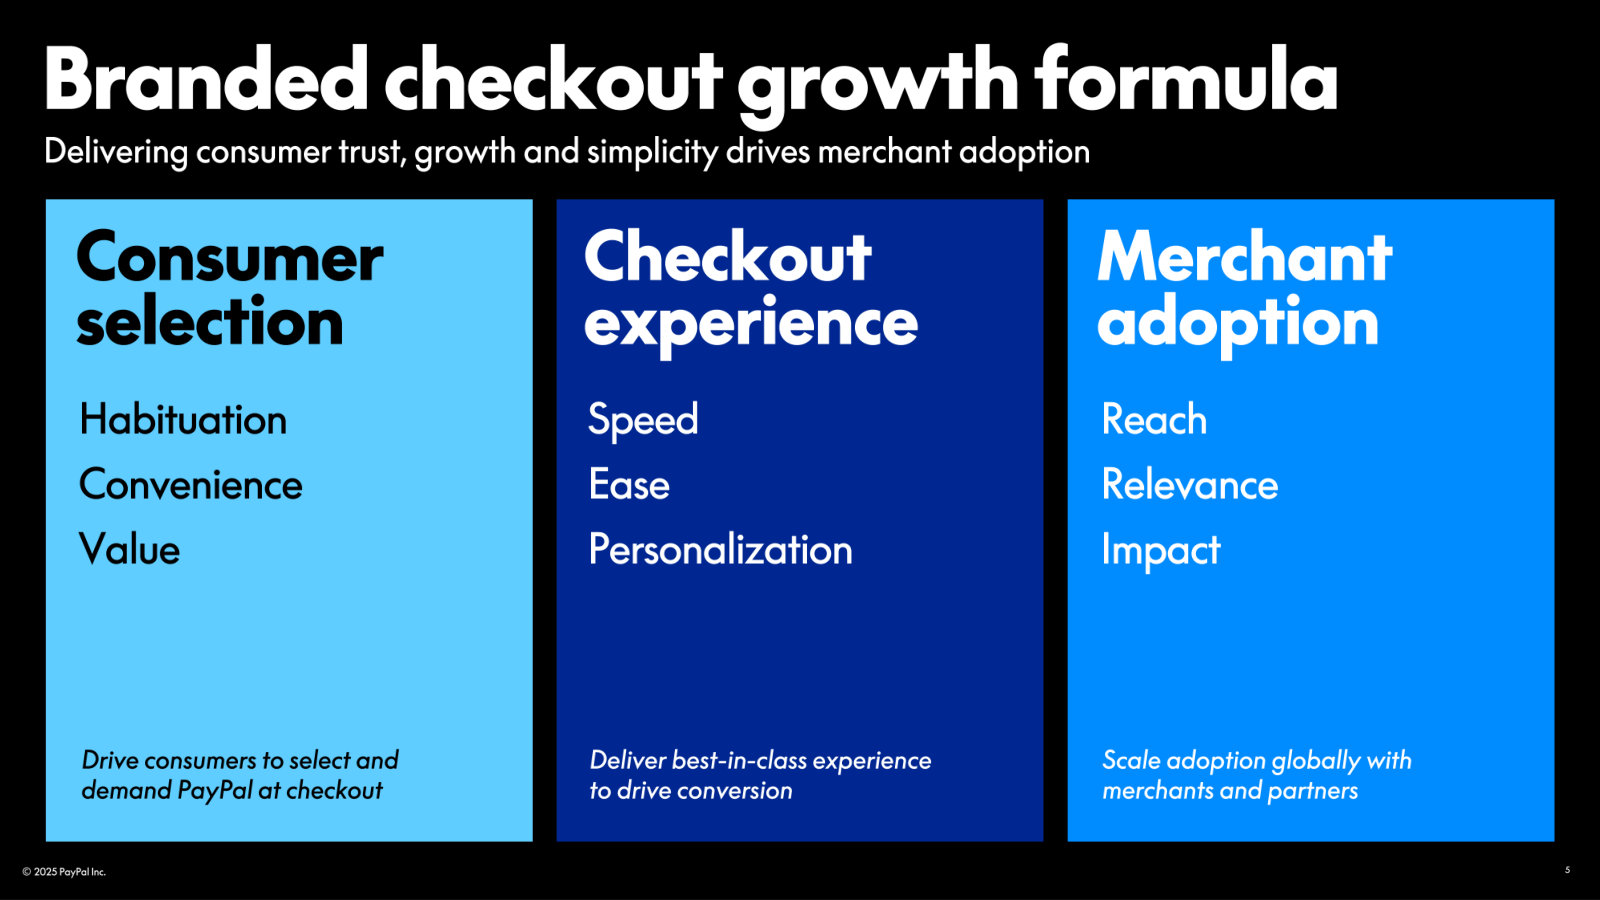
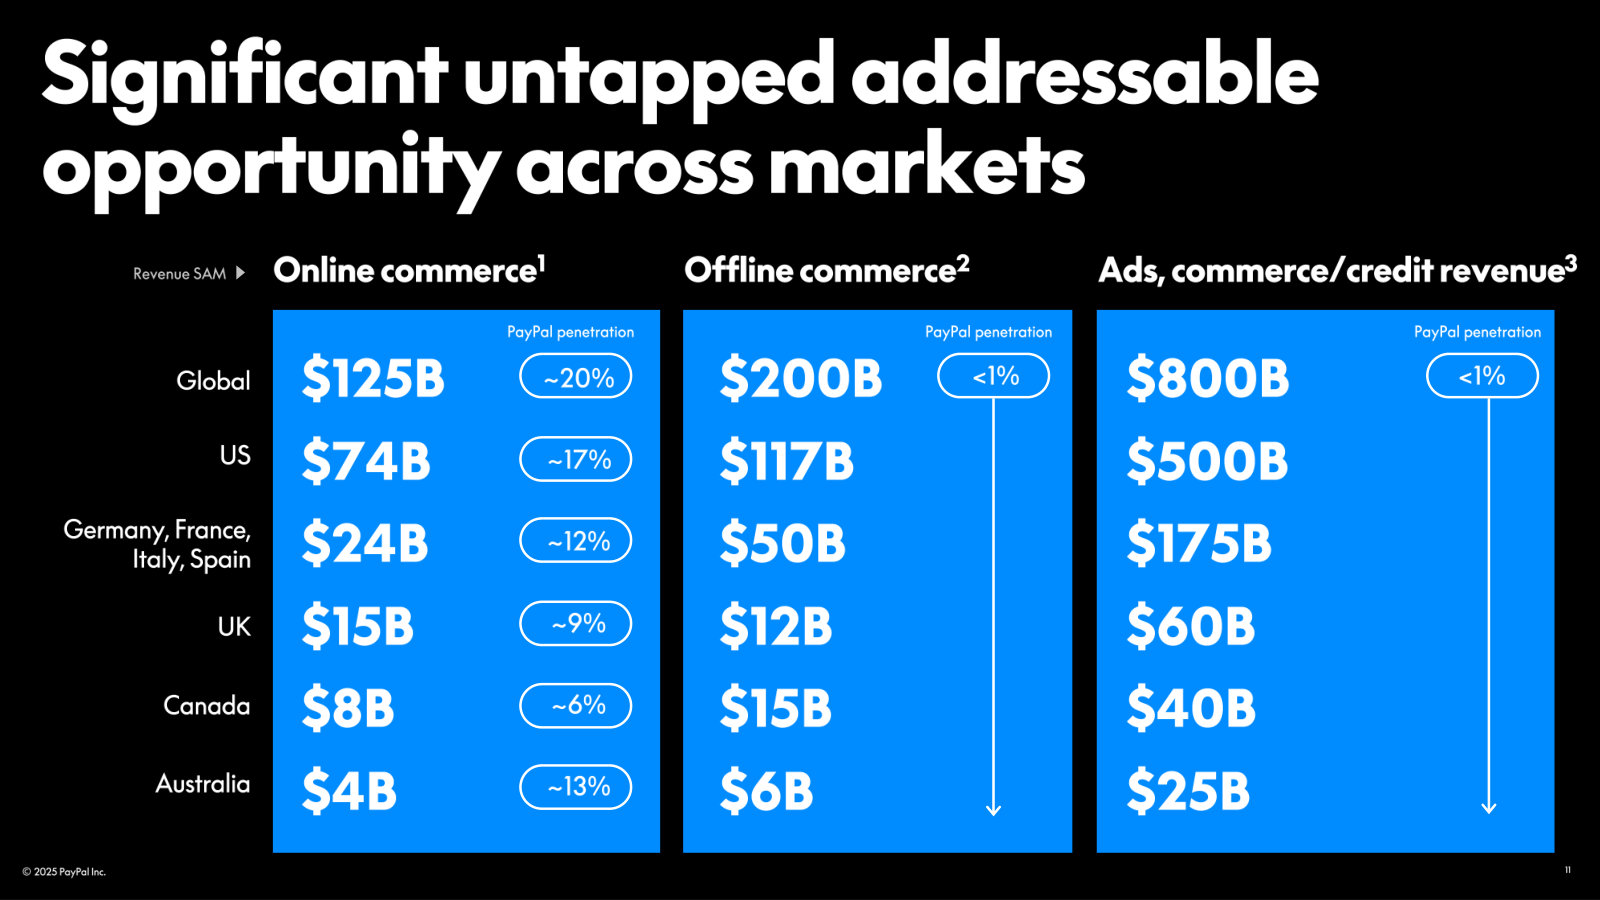
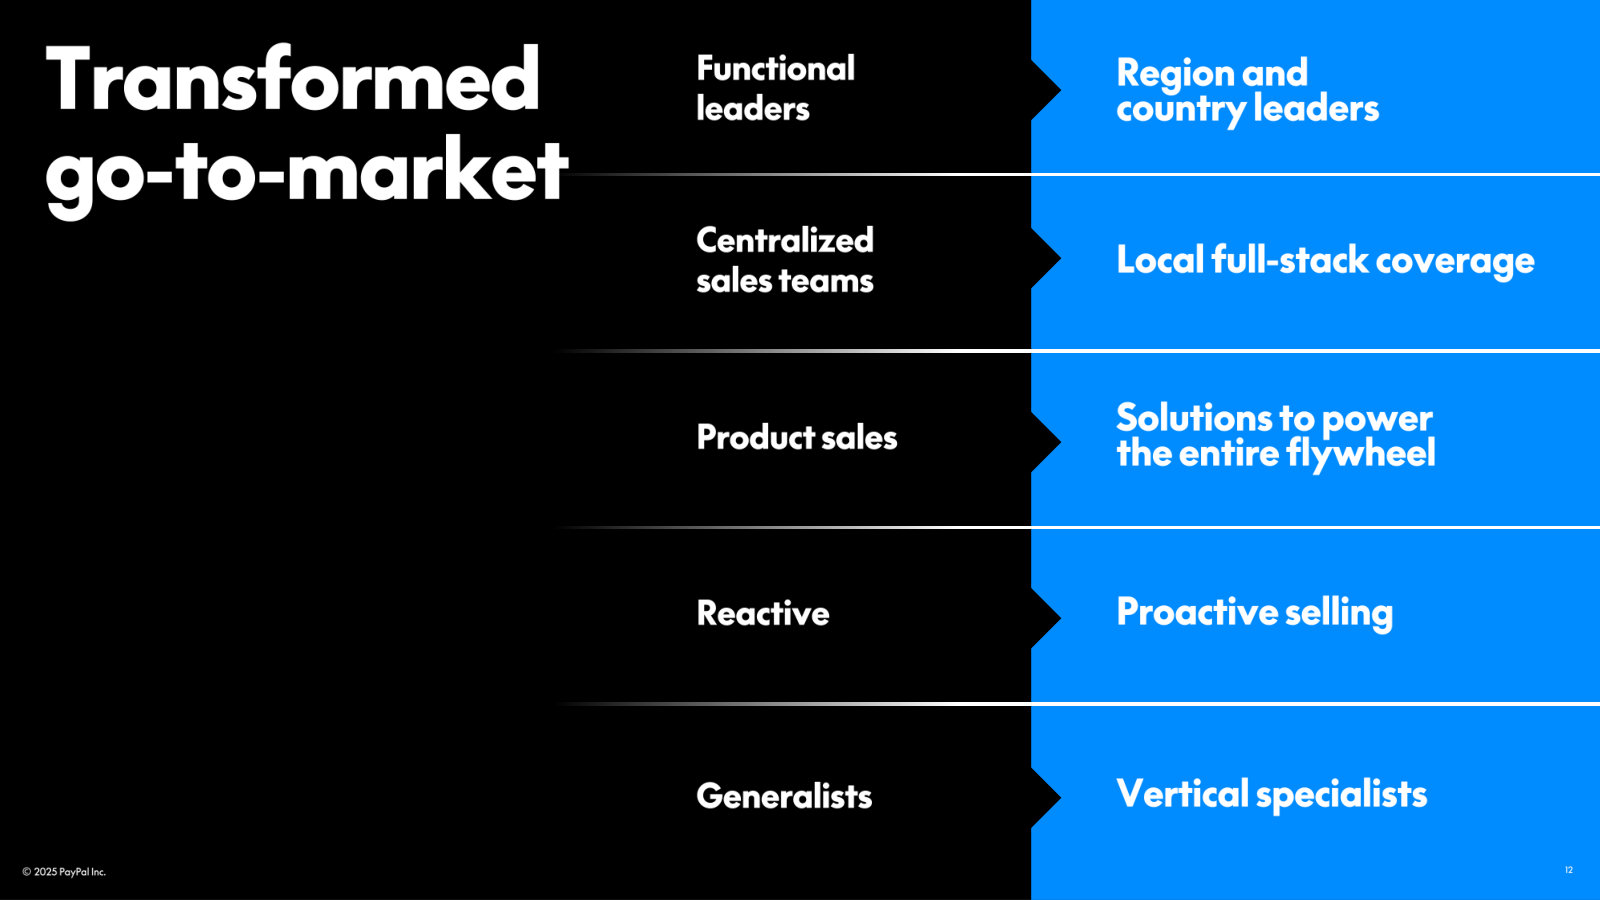
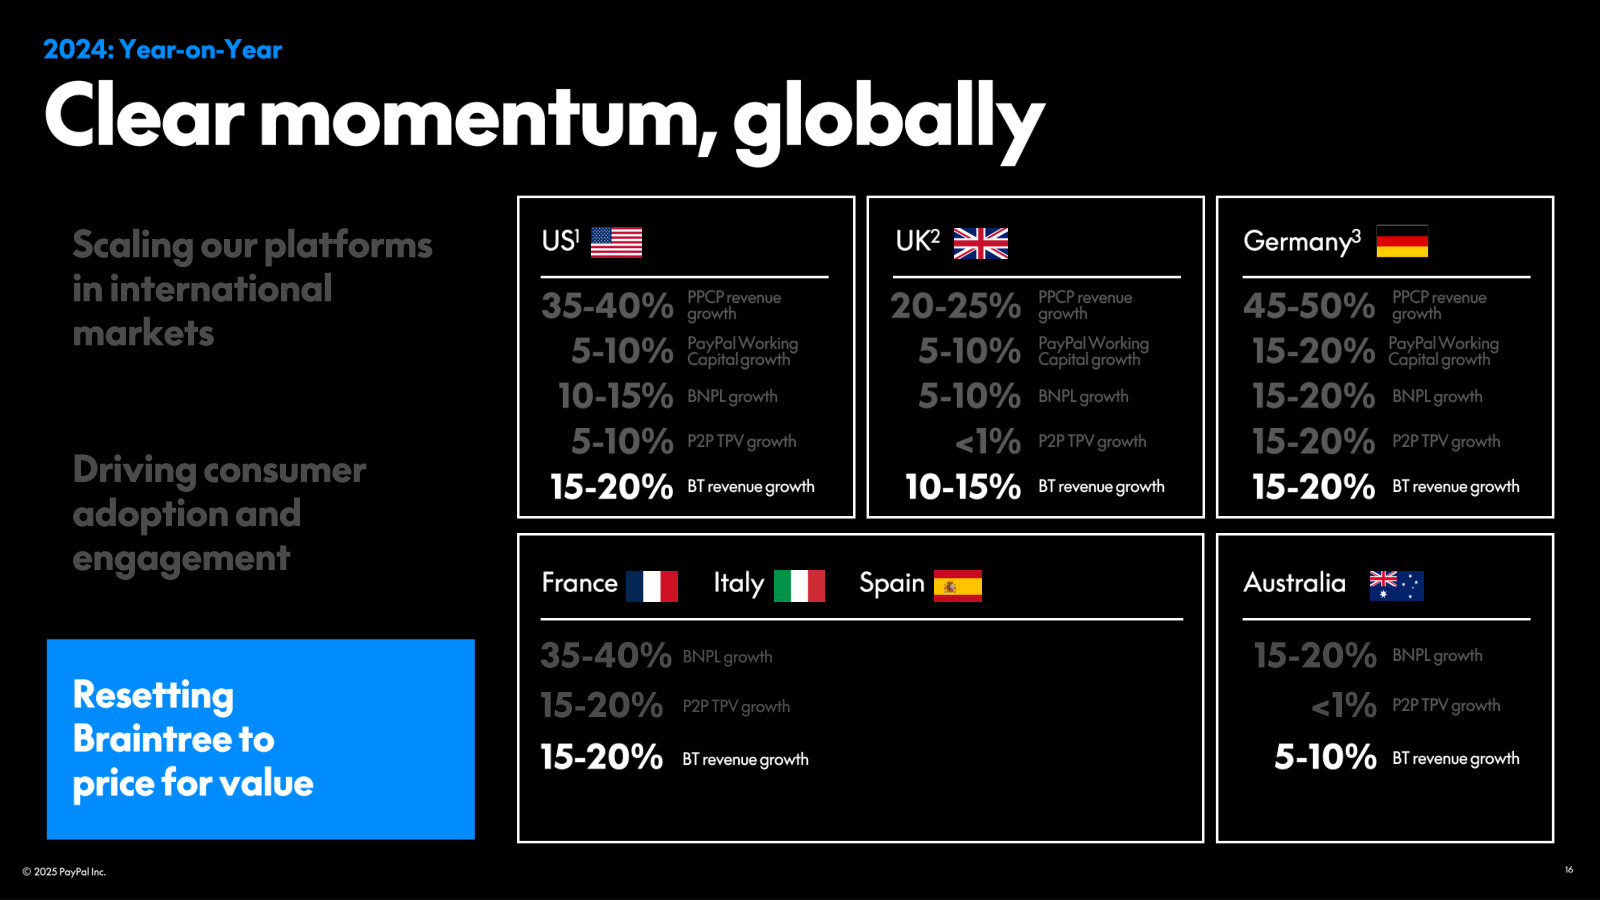
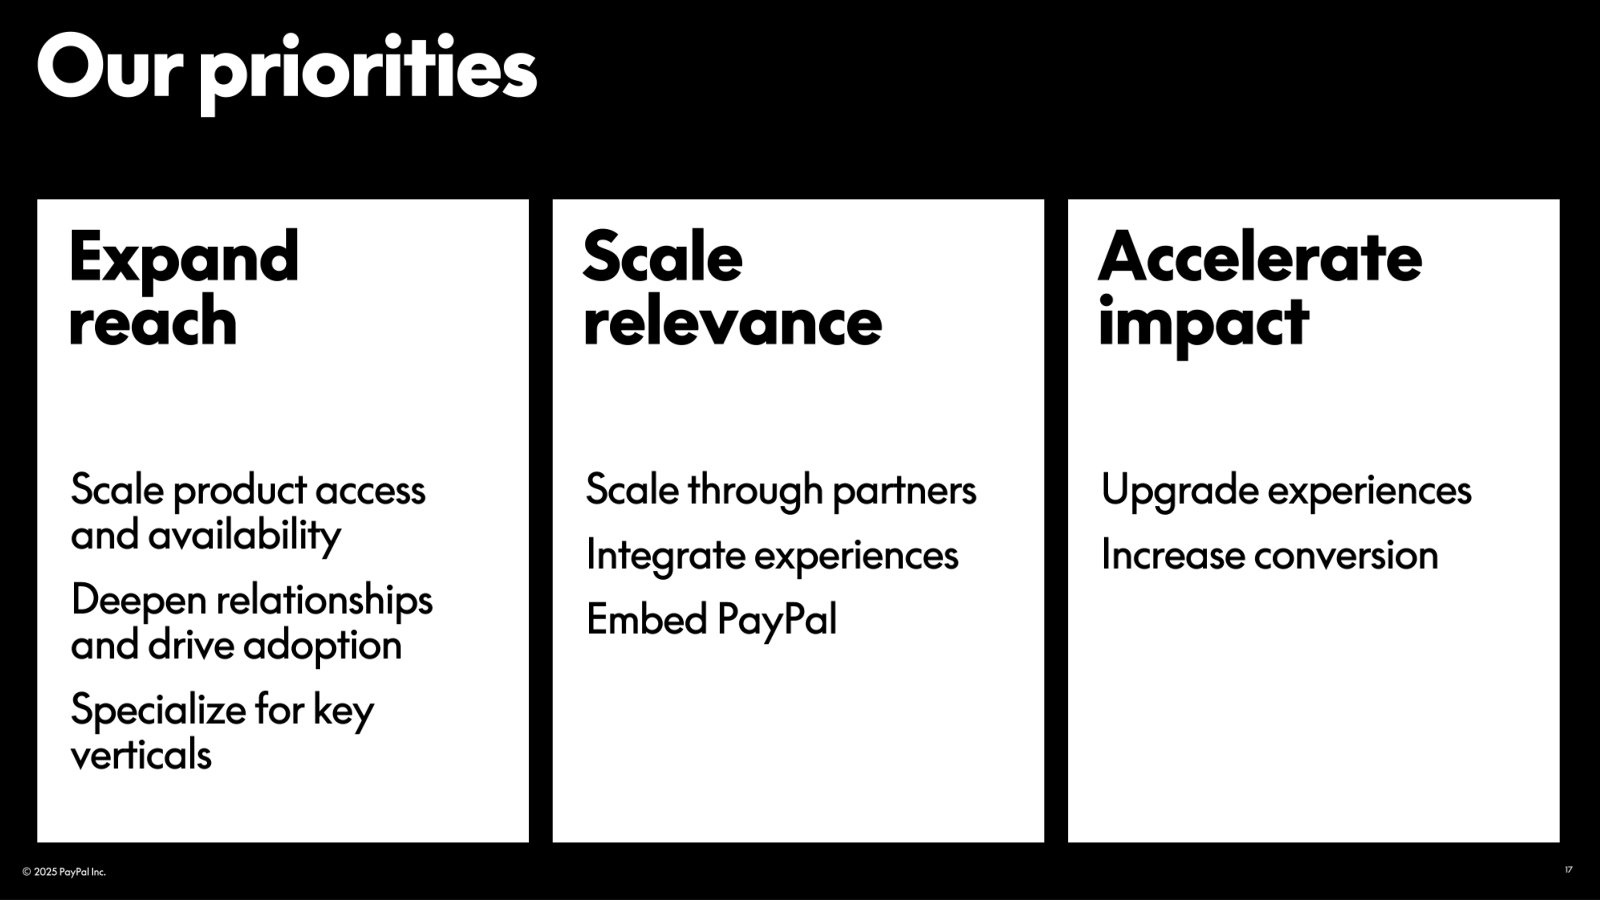
Investor Day 2025 — Strengthen Global Markets — Investor Day 2025
The Global Markets track of PayPal's 2025 Investor Day — the fullest explanation of the two-sided flywheel, its unit economics, the market, and the go-to-market. · Open the full document →
Q1 FY2026 Earnings Presentation — Q1 FY2026
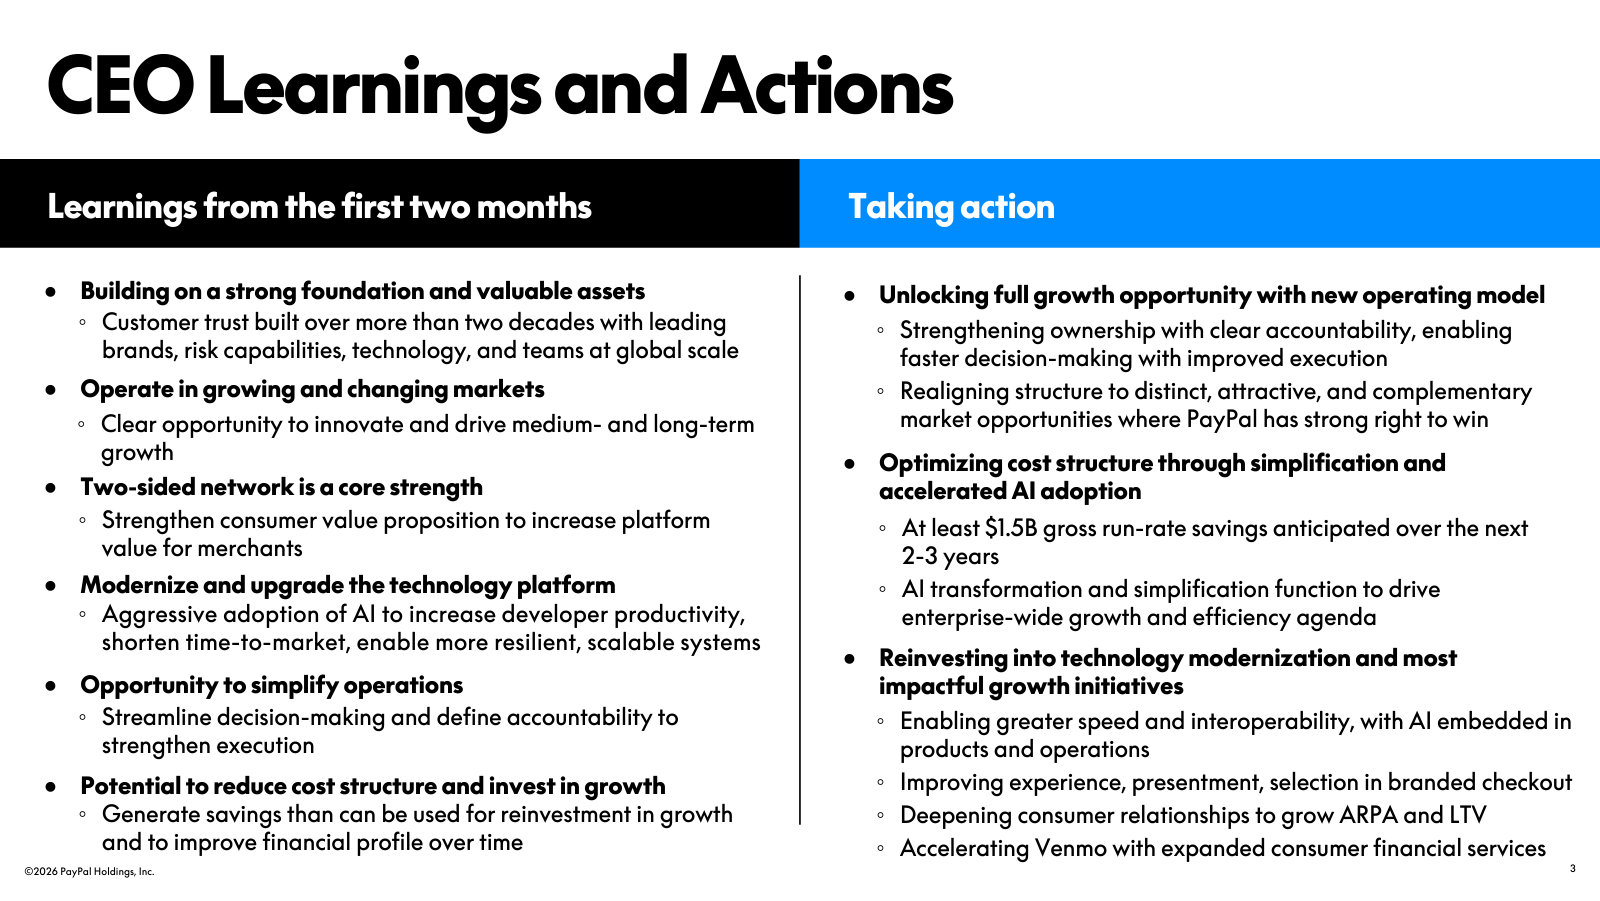
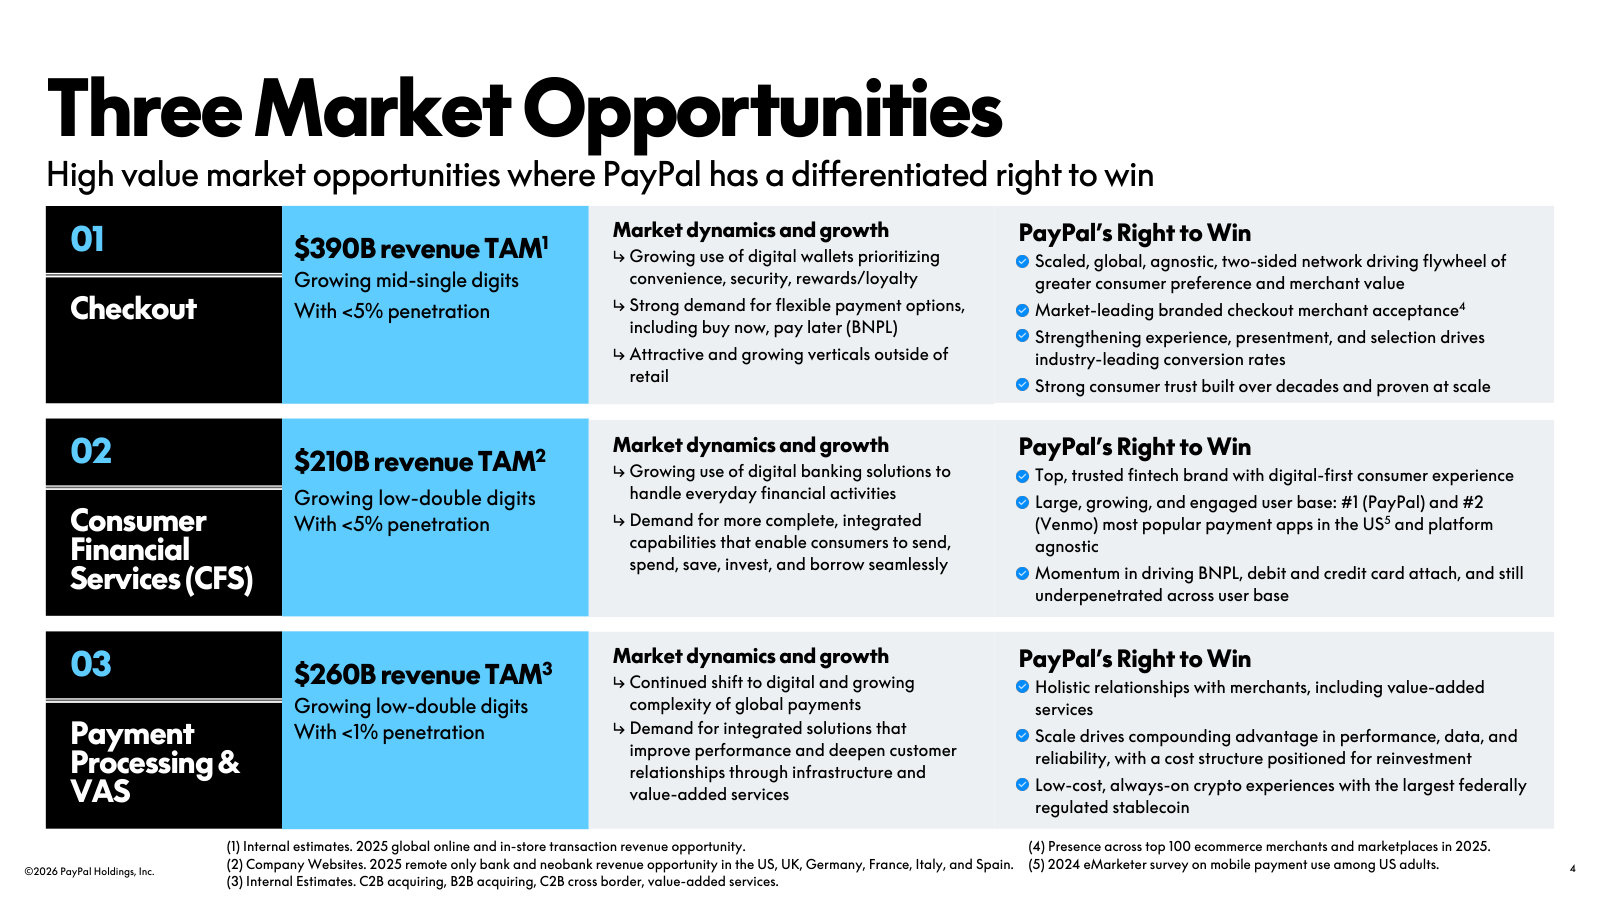
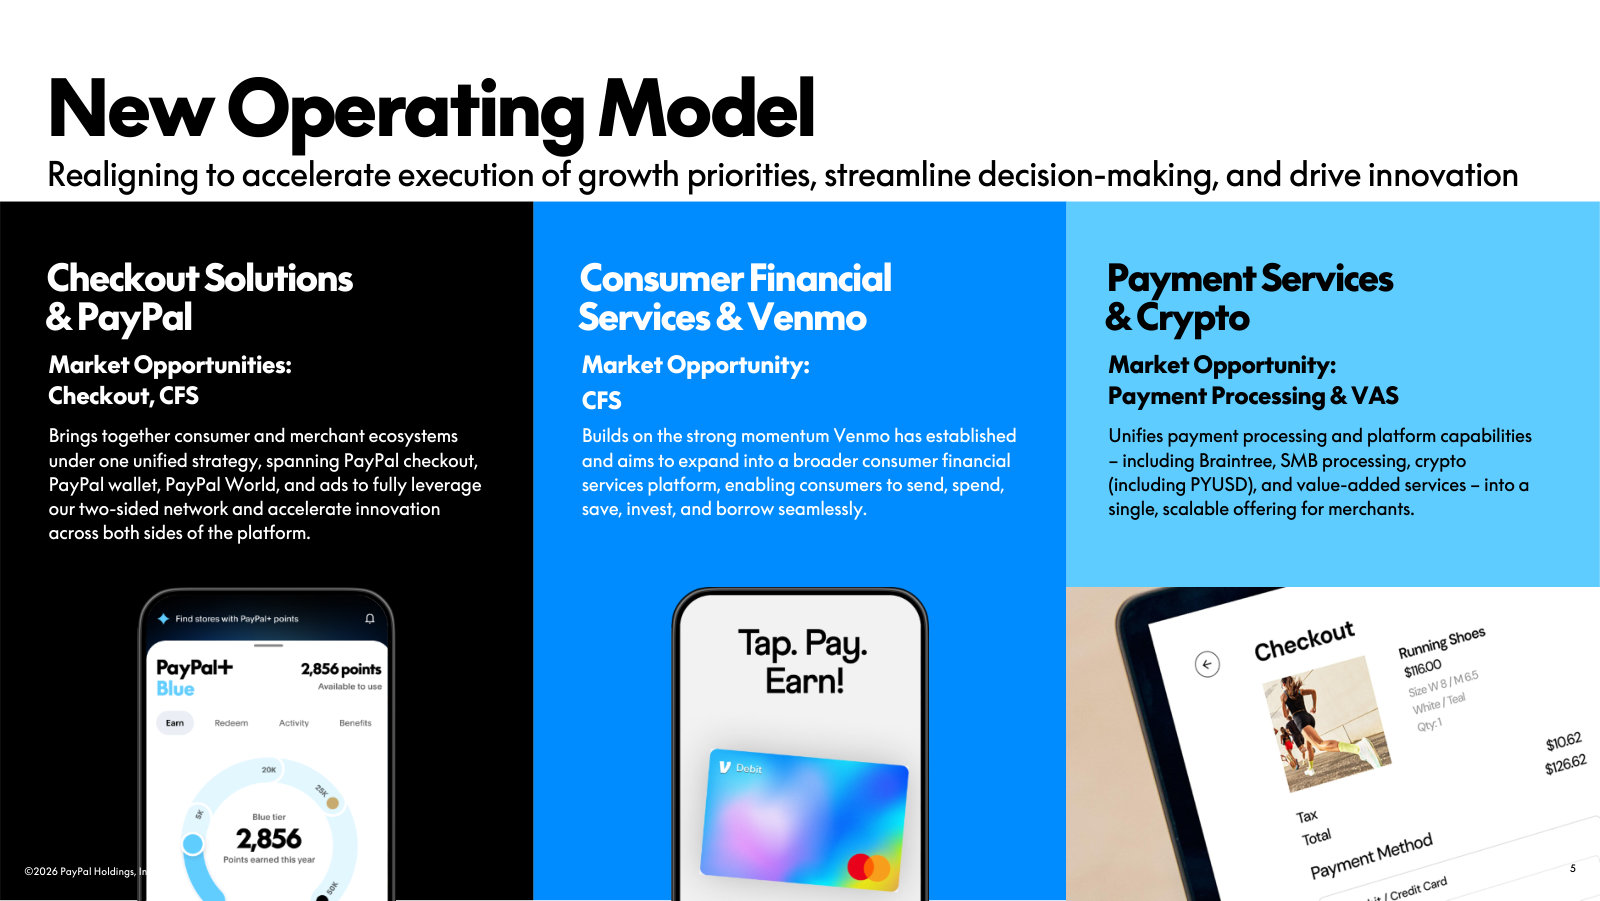
The current strategic picture under the new CEO — the read on the business, how the addressable market is now framed, and the operating model PayPal has reorganized into. · Open the full document →
More from management
Q4 & FY2025 Earnings Presentation — Q4 FY2025 · 29 pages · The FY2025 scorecard and the four-part growth-driver framework the new operating model has since replaced. · Open →
PayPal Holdings, Inc.'s management answers for the business every quarter. These are the exchanges that explain it best — verbatim, from the call transcripts preserved in Sources. Each link opens the full transcript at that page in a new tab.
Q1 FY2026 Earnings Call — Q1 FY2026
Enrique Lores's first call as CEO: the clearest statement yet of what a new leader thinks is broken and the framework he will use to fix it. · Open the full transcript →
The incoming CEO's diagnosis: strong assets, but strategic and operational problems that need real change.
Enrique Lores (CEO): I'm stepping into this role at an important moment for PayPal. I appreciate the opportunity to serve as CEO and I'm confident we will accelerate the growth of the company while improving profitability and cash flow. That is why I'm here. At the same time, I'm also realistic that we need to make significant changes to address the strategic and operational issues the company has faced. […] we need to recommit to the fundamentals. That includes becoming a technology company again, sharpening our focus on consumers, aligning the company around three strong businesses and simplifying how we work with clear accountability and a stronger emphasis on execution.
p. 1 · Read in context →
The reorganization into three single-owner businesses and the bet on unifying the two-sided network.
Enrique Lores (CEO): The changes we announced last week will organize the company into three lines of business, each with a single leader: Checkout Solutions and PayPal; Consumer Financial Services and Venmo; and Payment Services and Braintree. Importantly, we are bringing together the two sides of the network to maximize our competitive advantage.
p. 2 · Read in context →
The cost of the turnaround: growth investments are a deliberate ~3-point drag on transaction-margin-dollar growth this year.
Jamie Miller (Chief Financial and Operating Officer): We continue to expect our targeted growth investments to represent approximately a three-point headwind to transaction margin dollars growth in 2026, while driving durable long-term benefits in the years ahead.
p. 4 · Read in context →
Asked directly whether Venmo or Braintree could be sold, Lores commits to keeping and investing in all three.
Darrin Peller (Wolfe Research); Enrique Lores (CEO): can you just walk through your thought process on your review of your assets in the company in a sense of which assets you actually absolutely feel like you must keep as part of the go-forward entity? If there are assets you would consider selling, where you stand on Venmo. […] So let me start by saying that our number-one priority, my number-one priority, is to maximize shareholder value. At this point, I believe that the best approach is to invest in our three core businesses — PayPal, Venmo and Braintree — to drive profitable growth. Because in each of them, we see the opportunity to make it happen.
p. 8 · Read in context →
Where the checkout redesign actually stands — and why the new button is only one lever among many.
Enrique Lores (CEO): Today, 45% of non-volatile customers are already experiencing the new simplified version. So we have continued to make progress quarter-over-quarter and the plan is to continue that in the coming quarters. But it's not only about that. What we have learned is this is one element of the many that we need to do. When we combine our new checkout process with financial services and BNPL, we see also significant improvement and significant acceleration of growth.
p. 10 · Read in context →
Q4 & Full-Year FY2025 Earnings Call — Q4 FY2025
The call that broke the thesis: a CEO change, a branded-checkout collapse to 1% growth, and the withdrawal of the 2027 targets. · Open the full transcript →
The leadership change and an unusually blunt admission that execution has fallen short.
Jamie Miller (Interim CEO): The Board has appointed Enrique Lores, who was most recently our Board Chair, as the next President and CEO of PayPal effective March 1 to accelerate execution and bring greater discipline to how we implement our strategic priorities as we enter our next phase of growth. I want to thank Alex Chriss for his leadership and his many contributions to the company. […] At the same time, we recognize as a company that our execution has not been what it needs to be. We have not moved fast enough or with the level of focus required, and we are taking immediate steps to address that reality.
p. 1 · Read in context →
Guidance philosophy resets: the multi-year Investor Day outlook is pulled, replaced by one year at a time.
Jamie Miller (Interim CEO): given everything I've outlined, we are no longer committing to the specific outlook for 2027 we laid out at Investor Day last year. For these reasons, we think it's prudent for now to provide financial guidance one year at a time.
p. 4 · Read in context →
The hardest question on the change — is it about execution or a coming strategy overhaul? Management says execution.
Tien-Tsin Huang (JPMorgan); Jamie Miller (Interim CEO): can you give us some assurance that the change is primarily to address execution rather than the strategy? […] So the Board's decision is based on execution. They have been discussing this for the past few months. […] our execution is just too slow. And both the Board and Enrique have been deeply involved in setting our plans strategically and around our initiatives, and that carries into what our execution plan is in 2026.
p. 7 · Read in context →
The bear case, stated plainly — can branded be turned around, and can earnings grow if it can't?
Harshita Rawat (Bernstein); Jamie Miller (Interim CEO): I think a question which is in investors' minds is whether the branded business can be turned around or if the shift has tailed. […] Can PayPal grow earnings if branded doesn't improve from here? […] even with a low mid-single-digit branded checkout profile in 2025, we delivered very solid transaction margin dollar growth. We delivered mid-teens earnings per share growth. And so I think there continues to be a lot of ways we can win here.
p. 11 · Read in context →
Why PayPal won't just go all-in on merchants: the two-sided network only works with both sides.
Dan Dolev (Mizuho); Steven Winoker (Chief Investor Relations Officer): it's our view that you can't win without both. The consumer, you've got to bring strength with the consumer to these merchant negotiations and discussions. That's one of the major reasons merchants want to work with us. And at the same time, you need to bring merchants to the consumers as well. So both are absolutely critical.
p. 12 · Read in context →
Q1 FY2024 Earnings Call — Q1 FY2024
Chriss's transformation year in operating detail — Fastlane, pricing Braintree to value, and the unit economics behind engagement. · Open the full transcript →
The debut of Fastlane, PayPal's guest-checkout play to win the ~60% of shoppers who don't log in.
Alex Chriss (President and CEO): We continue to make good progress in our early testing of Fastlane by PayPal with a focused group of merchants. Data from those alpha merchants show that returning Fastlane users are converting at nearly 80%. We are just getting started and already creating a low double-digit lift in guest checkout conversion for participating merchants.
p. 2 · Read in context →
The 'price to value' pivot on the unbranded/Braintree side, monetizing value-added services rather than chasing volume.
Alex Chriss (President and CEO): We've begun active discussions with our largest enterprise customers to focus on commercial outcomes that reflect the true value of our payments processing platform and the services we provide. […] As we evaluate our programs, we see clear opportunities to price to value, not only with our PSP processing but especially with our value-added services that we already provide, services such as payouts, fraud prevention, and processing orchestration.
p. 2 · Read in context →
The economics behind the strategy: deeper product adoption roughly doubles revenue per merchant account.
Alex Chriss (President and CEO): On average, merchants who adopt PPCP use approximately 4 PayPal products, which deepens the relationship and reduces churn. This translates to an average revenue per account for our PPCP full-stack merchant that is nearly 2x that of an SMB on a legacy integration.
p. 2 · Read in context →
Q3 FY2023 Earnings Call — Q3 FY2023
Alex Chriss's first call as CEO — the diagnosis of a company that lost focus and the pivot from growth-at-all-costs to profitable growth. · Open the full transcript →
The new CEO's opening read: strong assets, but scattered focus and unclear execution.
Alex Chriss (President and CEO): Our innovation activity has accelerated but we still have work to do on maximizing our impact for our customers' end results. Competition and complexity have increased, and the company's focus has not been clear. […] But let me be clear, notwithstanding those realities, this is a growth company with great prospects.
p. 5 · Read in context →
The defining pivot: profit, not user count, becomes the yardstick for how the company is run.
Alex Chriss (President and CEO): what I care about most is high-quality customer growth and profitable revenue growth. Going forward, PayPal will be focused on generating real profit for the company. I can't emphasize that last statement enough. […] Unprofitable growth is counterproductive to the long-term prospects of this or any other growth-oriented company.
p. 11 · Read in context →
How Braintree makes money at scale — and the plan to convert that volume into margin.
Alex Chriss (President and CEO): We have proven that we can win in the market and take share with Braintree, serving the largest enterprises such as Adobe, Booking.com, DoorDash, Ticketmaster and Uber. In the last 12 months, we processed over $450 billion in volume out of an estimated $4 trillion to $5 trillion of global large enterprise ecommerce. That's approximately 10% flowing through us.
p. 9 · Read in context →
Putting the profit-over-growth pivot into practice: deliberately churning off low-quality accounts.
Gabrielle Rabinovitch (SVP Corporate Finance and Acting CFO): during the quarter, active accounts declined by 2.8 million as we continue to flush out low-quality customers predominantly in Latin America and Southeast Asia. As a reminder, we said this would be a year where we churn off lower-quality actives and in which total accounts would decline.
p. 13 · Read in context →
Q4 & Full-Year FY2021 Earnings Call — Q4 FY2021
The Schulman-era reset: PayPal abandons its 750-million-account ambition and cuts guidance, marking the top before the multi-year de-rating. · Open the full transcript →
The scale of the franchise at its pandemic peak — and the engagement metric management would come to prize.
Dan Schulman (President and CEO): We surpassed $1 trillion in annual TPV for the first time in our history, ending the year with $1.25 trillion of total payment volume. We had a record 5.3 billion transactions in Q4 alone, up 21%. We added 49 million net new active accounts to exit the year with 426 million active accounts, including 34 million merchants. In the last two years, we added 122 million net new active accounts. And despite that spike in new users, our transactions per active account grew to 45 this past year, an 11% increase.
p. 4 · Read in context →
The eBay overhang quantified: a 700-basis-point drag on revenue growth as the marketplace migrated off PayPal.
Dan Schulman (President and CEO): eBay's migration to managed payments happened faster than we anticipated. Overall, eBay put $1.4 billion of pressure on our top line, reducing our revenue growth by 700 basis points. Ex eBay, our revenue growth was very strong, growing 29% on a spot basis for the full year and 22% in Q4.
p. 4 · Read in context →
The rationale for the engagement pivot: app users are worth far more and churn far less than checkout-only users.
Dan Schulman (President and CEO): our super app is showing extraordinarily promising early results. Now we only rolled that out fully in the middle of October across all of iOS and Android, so we're three or four months into it. But what are we seeing? We're seeing double the average revenue per active account when somebody uses our app versus just checkout. When somebody uses the app their propensity to churn is 25% less.
p. 24 · Read in context →
The guidance cut: 2022 revenue growth trimmed to 15%–17% from a previously indicated ~18%.
Dan Schulman (President and CEO): The persistence of inflationary effects on personal consumption, labor shortages, supply chain issues, and weaker consumer sentiment have led us to adopt a more cautious outlook. On last quarter's call, we preliminarily indicated high teens revenue growth for this year and said that if we had to pinpoint it, it would be around 18%. We have an incredible business, but we are not immune to the vagaries of the economy. Based on our more conservative stance today, we are starting the year with an expectation for revenue growth in the range of 15% to 17%.
p. 13 · Read in context →
More calls
Q3 FY2025 Earnings Call — Q3 FY2025 · 14 pages · Alex Chriss's last full quarter as CEO — the branded-checkout softening that set up the leadership change was already visible here. · Open →
Q1 FY2025 Earnings Call — Q1 FY2025 · 12 pages · The first read on execution against the February 2025 Investor Day plan, before the year's targets came under pressure. · Open →
Q4 & Full-Year FY2024 Earnings Call — Q4 FY2024 · 11 pages · Where the multi-year Investor Day framework and 2027 outlook — later withdrawn in Q4 2025 — were originally laid out. · Open →
Q2 FY2024 Earnings Call — Q2 FY2024 · 13 pages · Fastlane moving toward general availability and further detail on pricing Braintree and value-added services to value. · Open →
Q2 FY2023 Earnings Call — Q2 FY2023 · 32 pages · Dan Schulman's final earnings call as CEO, just before the handover to Alex Chriss. · Open →
Q1 FY2023 Earnings Call — Q1 FY2023 · 35 pages · Late-Schulman-era cost discipline and operating-margin framing, the backdrop Chriss inherited. · Open →
Q4 & Full-Year FY2022 Earnings Call — Q4 FY2022 · 35 pages · The trough year in full: the cost-cutting response after the 2022 guidance resets and the CEO-succession announcement. · Open →
Q3 FY2021 Earnings Call — Q3 FY2021 · 33 pages · Pandemic-peak growth, when the 750-million-account ambition and super-app strategy were still in full force. · Open →
PayPal Holdings, Inc.'s annual reports contain management's most considered account of the business. These are the sections, passages and visual pages worth opening in the originals preserved in Sources.
PayPal Holdings, Inc. — FY2025 Annual Report (Form 10-K) — FY2025 (year ended Dec 31, 2025)
The latest 10-K, and the one that documents PayPal's shift from volume-at-any-cost to profitable growth — transactions actually fell while margin rose. · Open the full document →
Item 1. Business — Overview — p. 5 · Read the full section →
The cleanest statement of what PayPal is: a two-sided network of 439M accounts that earns fees on transaction volume, plus a ladder of value-added revenue.
The two-sided network and how it earns money — volume fees first, value-added services second.
We operate a global, two-sided network at scale that connects consumers and merchants with 439 million active accounts across approximately 200 markets as of December 31, 2025. […] We earn revenues primarily by charging fees for completing payment transactions for our customers and other payment-related services, which are typically based on the volume of activity processed on our payments platform. We also generate revenue from customers for currency conversion, for instant transfers from their PayPal or Venmo account to their bank account or debit card, and to facilitate the purchase and sale of cryptocurrencies; however, we generally do not charge customers to fund or draw from their accounts.
p. 5 · Read in context →
Item 1. Business — Consumer and Merchant Payment Solutions — p. 9 · Read the full section →
The product architecture that drives the whole model: high-margin branded checkout (PayPal/Venmo) versus lower-margin unbranded processing (Braintree).
Branded checkout — the higher-margin, conversion-driving front door.
Our PayPal and Venmo branded checkout experiences allow customers to complete purchases in just a few steps without having to enter payment and address information. These seamless experiences reduce cart abandonment and drive higher conversion rates for merchants.
p. 9 · Read in context →
Unbranded processing (Braintree) — the scale-volume engine behind the profitable-growth reset.
Our unbranded payments processing solutions allow merchants to quickly and easily provide digital checkout online with a variety of popular ways to pay, including debit and credit cards, digital wallets, BNPL, certain cryptocurrencies, and local payment methods.
p. 9 · Read in context →
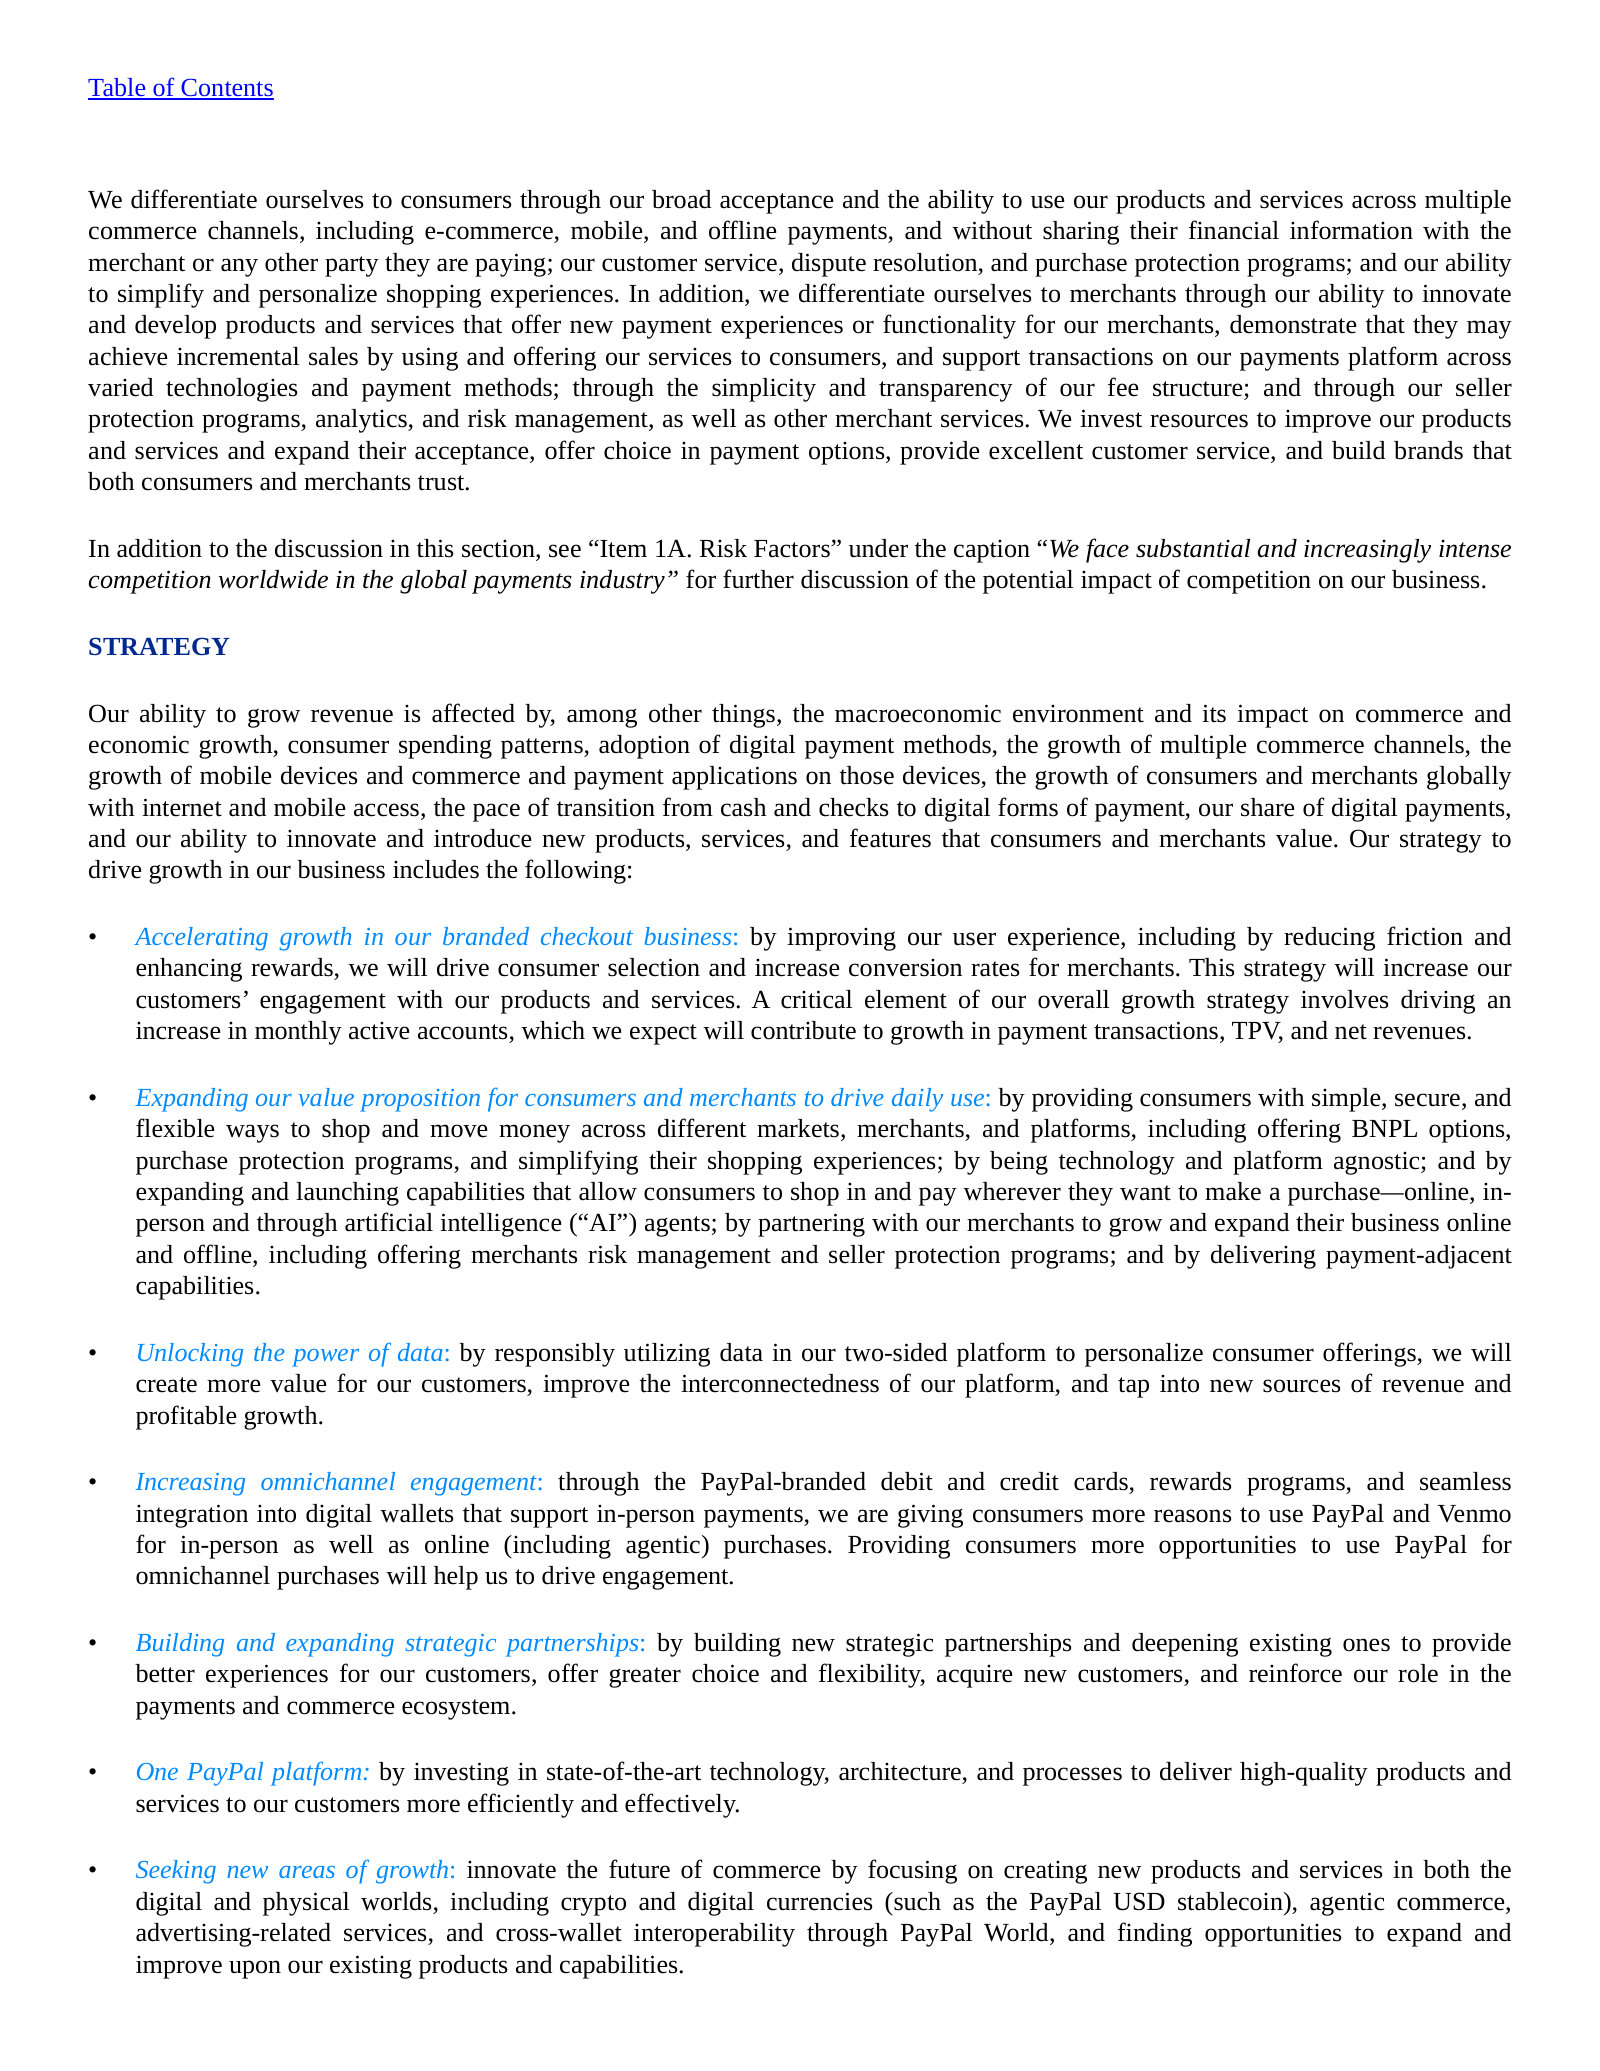
Item 1. Business — Strategy — p. 12 · Read the full section →
Management's seven growth pillars in its own words — from accelerating branded checkout to agentic commerce and the PayPal USD stablecoin.
Item 1A. Risk Factors — Business and Operations Risks — p. 36 · Read the full section →
The two forces that move PayPal's transaction margin most directly — network fee changes and shifts in how consumers fund payments.
Card-network and bank fee changes — a cost line PayPal does not control.
From time to time, the networks have increased the fees and assessments that they charge for transactions that access their networks. Certain networks have also imposed special fees or assessments for transactions that are executed through digital wallets such as those PayPal offers. […] Any increase in interchange fees, special fees, or assessments for transactions that we pay to networks or payment processors could make our pricing less competitive, increase our operating costs, and reduce our operating income, which could materially harm our business, financial condition, and results of operations.
p. 36 · Read in context →
Item 7. MD&A — Overview of Results of Operations — p. 59 · Read the full section →
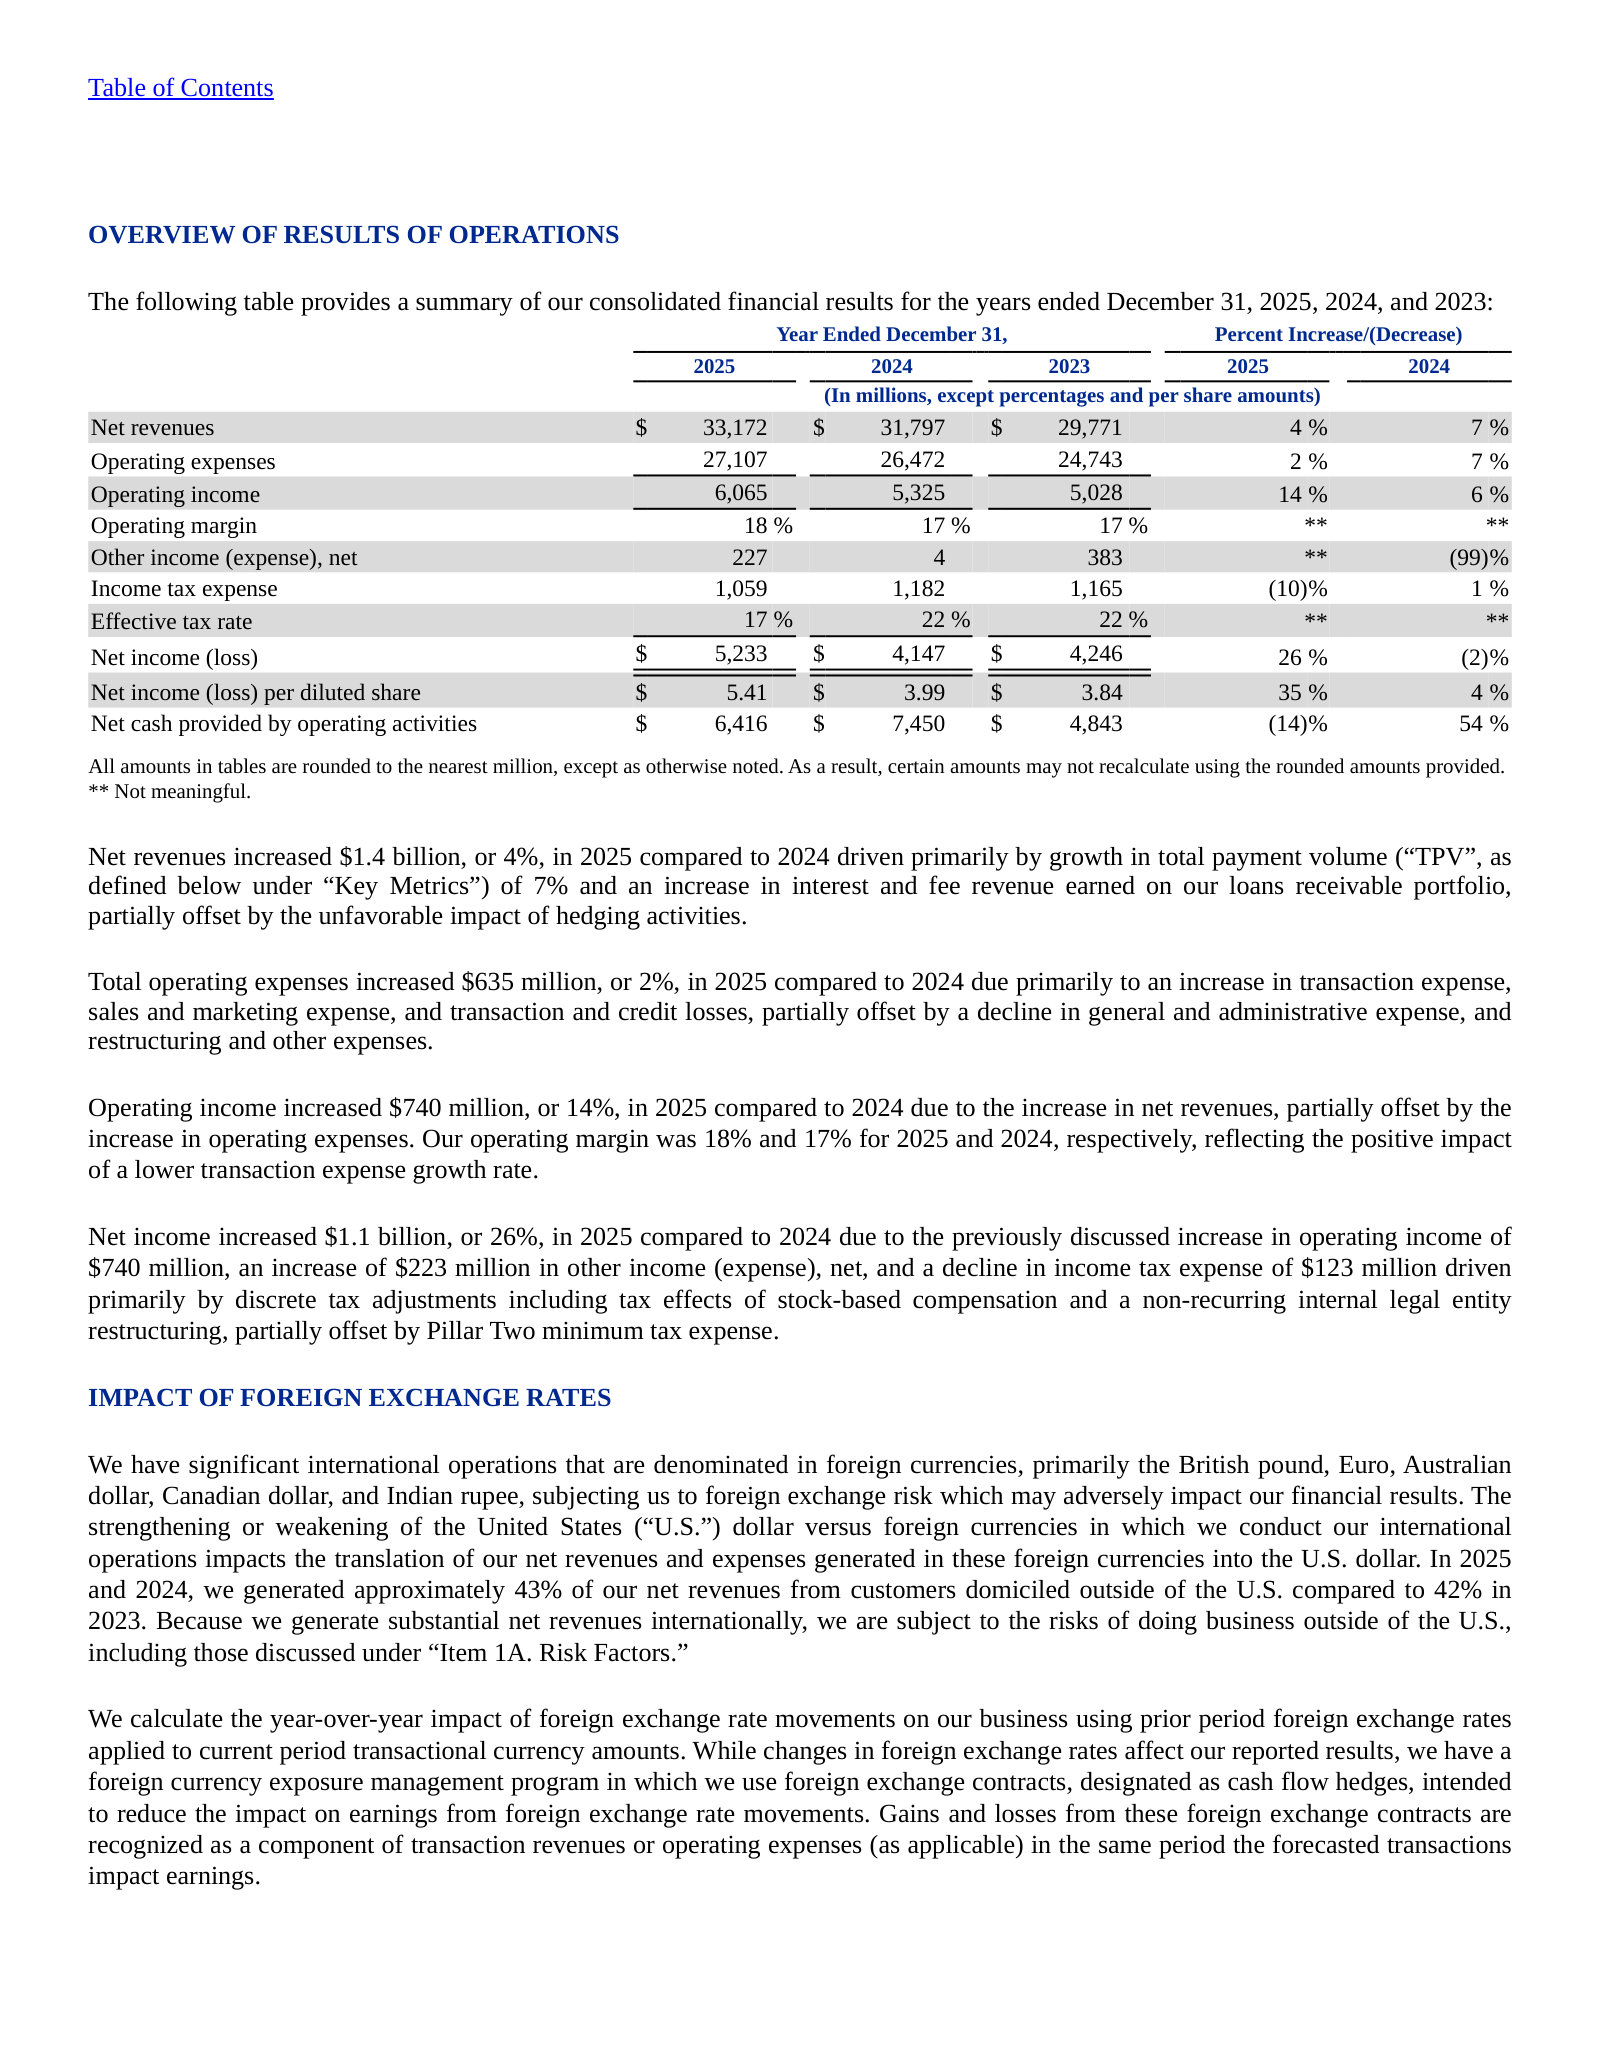
The full year on one page: net revenue +4%, operating margin up to 18%, and net income +26% to $5.41 diluted EPS.
Item 7. MD&A — Net Revenues — p. 63 · Read the full section →
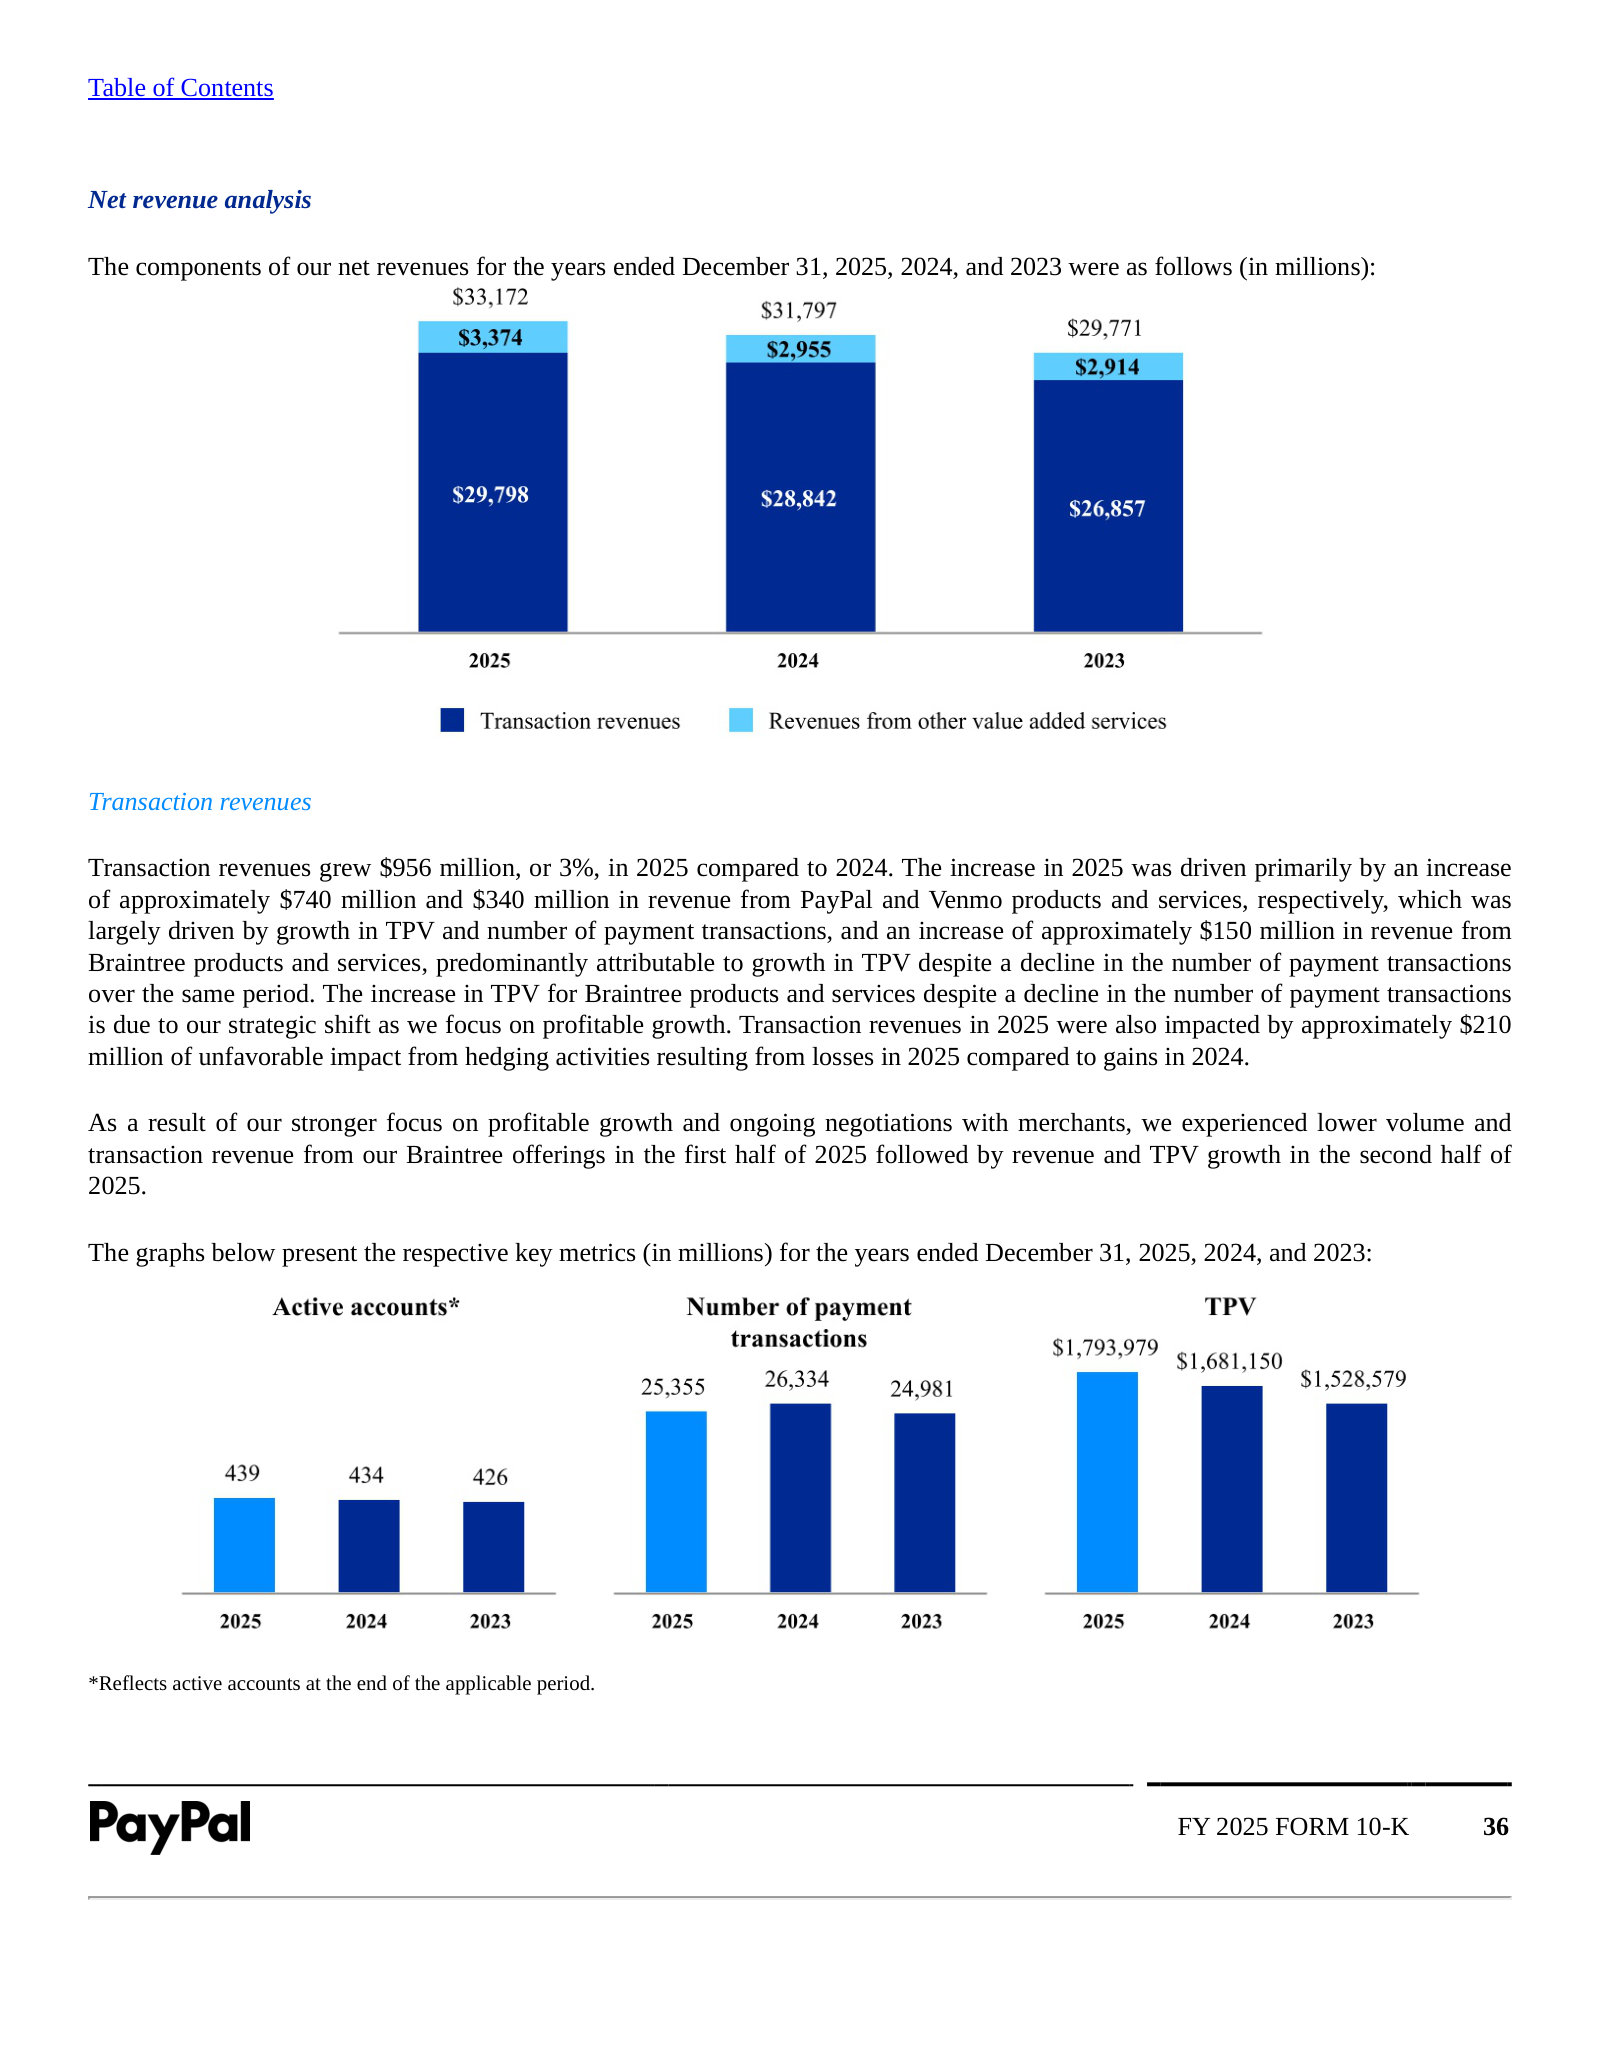
The heart of the FY2025 story: TPV grew 7% while payment transactions fell 4%, because management deliberately shed low-margin Braintree volume.
The profitable-growth pivot stated plainly — volume down on purpose, then recovering.
The increase in TPV for Braintree products and services despite a decline in the number of payment transactions is due to our strategic shift as we focus on profitable growth. […] As a result of our stronger focus on profitable growth and ongoing negotiations with merchants, we experienced lower volume and transaction revenue from our Braintree offerings in the first half of 2025 followed by revenue and TPV growth in the second half of 2025.
p. 64 · Read in context →
Item 7. MD&A — Operating Expenses: Transaction Expense — p. 66 · Read the full section →
Where the margin gain actually came from — funding mix and a lower Braintree weighting cut the transaction expense rate to 0.89%.
Funding-source economics and why the FY2025 mix lowered the expense rate.
The cost of funding a transaction with a credit or debit card is generally higher than the cost of funding a transaction from a bank or through internal sources such as a PayPal or Venmo account balance or our consumer credit products. […] The decrease in transaction expense rate in 2025 compared to 2024 was primarily attributable to a lower proportion of TPV from Braintree products and services, which generally have higher expense rates than other products and services, and changes in merchant mix.
p. 66 · Read in context →
PayPal Holdings, Inc. — FY2021 Annual Report (Form 10-K) — FY2021 (year ended Dec 31, 2021)
The pre-reset peak, kept for contrast: a COVID-era scorecard that framed the company around raw account and volume growth — the mindset FY2025 walked away from. · Open the full document →
Item 1. Business — Overview — p. 5 · Read the full section →
The older mission language — 'democratizing financial services' and ESG framing — reads very differently from FY2025's blunt focus on profitable growth.
FY2021's mission framing, centered on financial inclusion rather than margin.
PayPal Holdings, Inc. was incorporated in Delaware in January 2015 and is a leading technology platform that enables digital payments and simplifies commerce experiences on behalf of merchants and consumers worldwide. PayPal is committed to democratizing financial services to help improve the financial health of individuals and to increase economic opportunity for entrepreneurs and businesses of all sizes around the world.
p. 5 · Read in context →
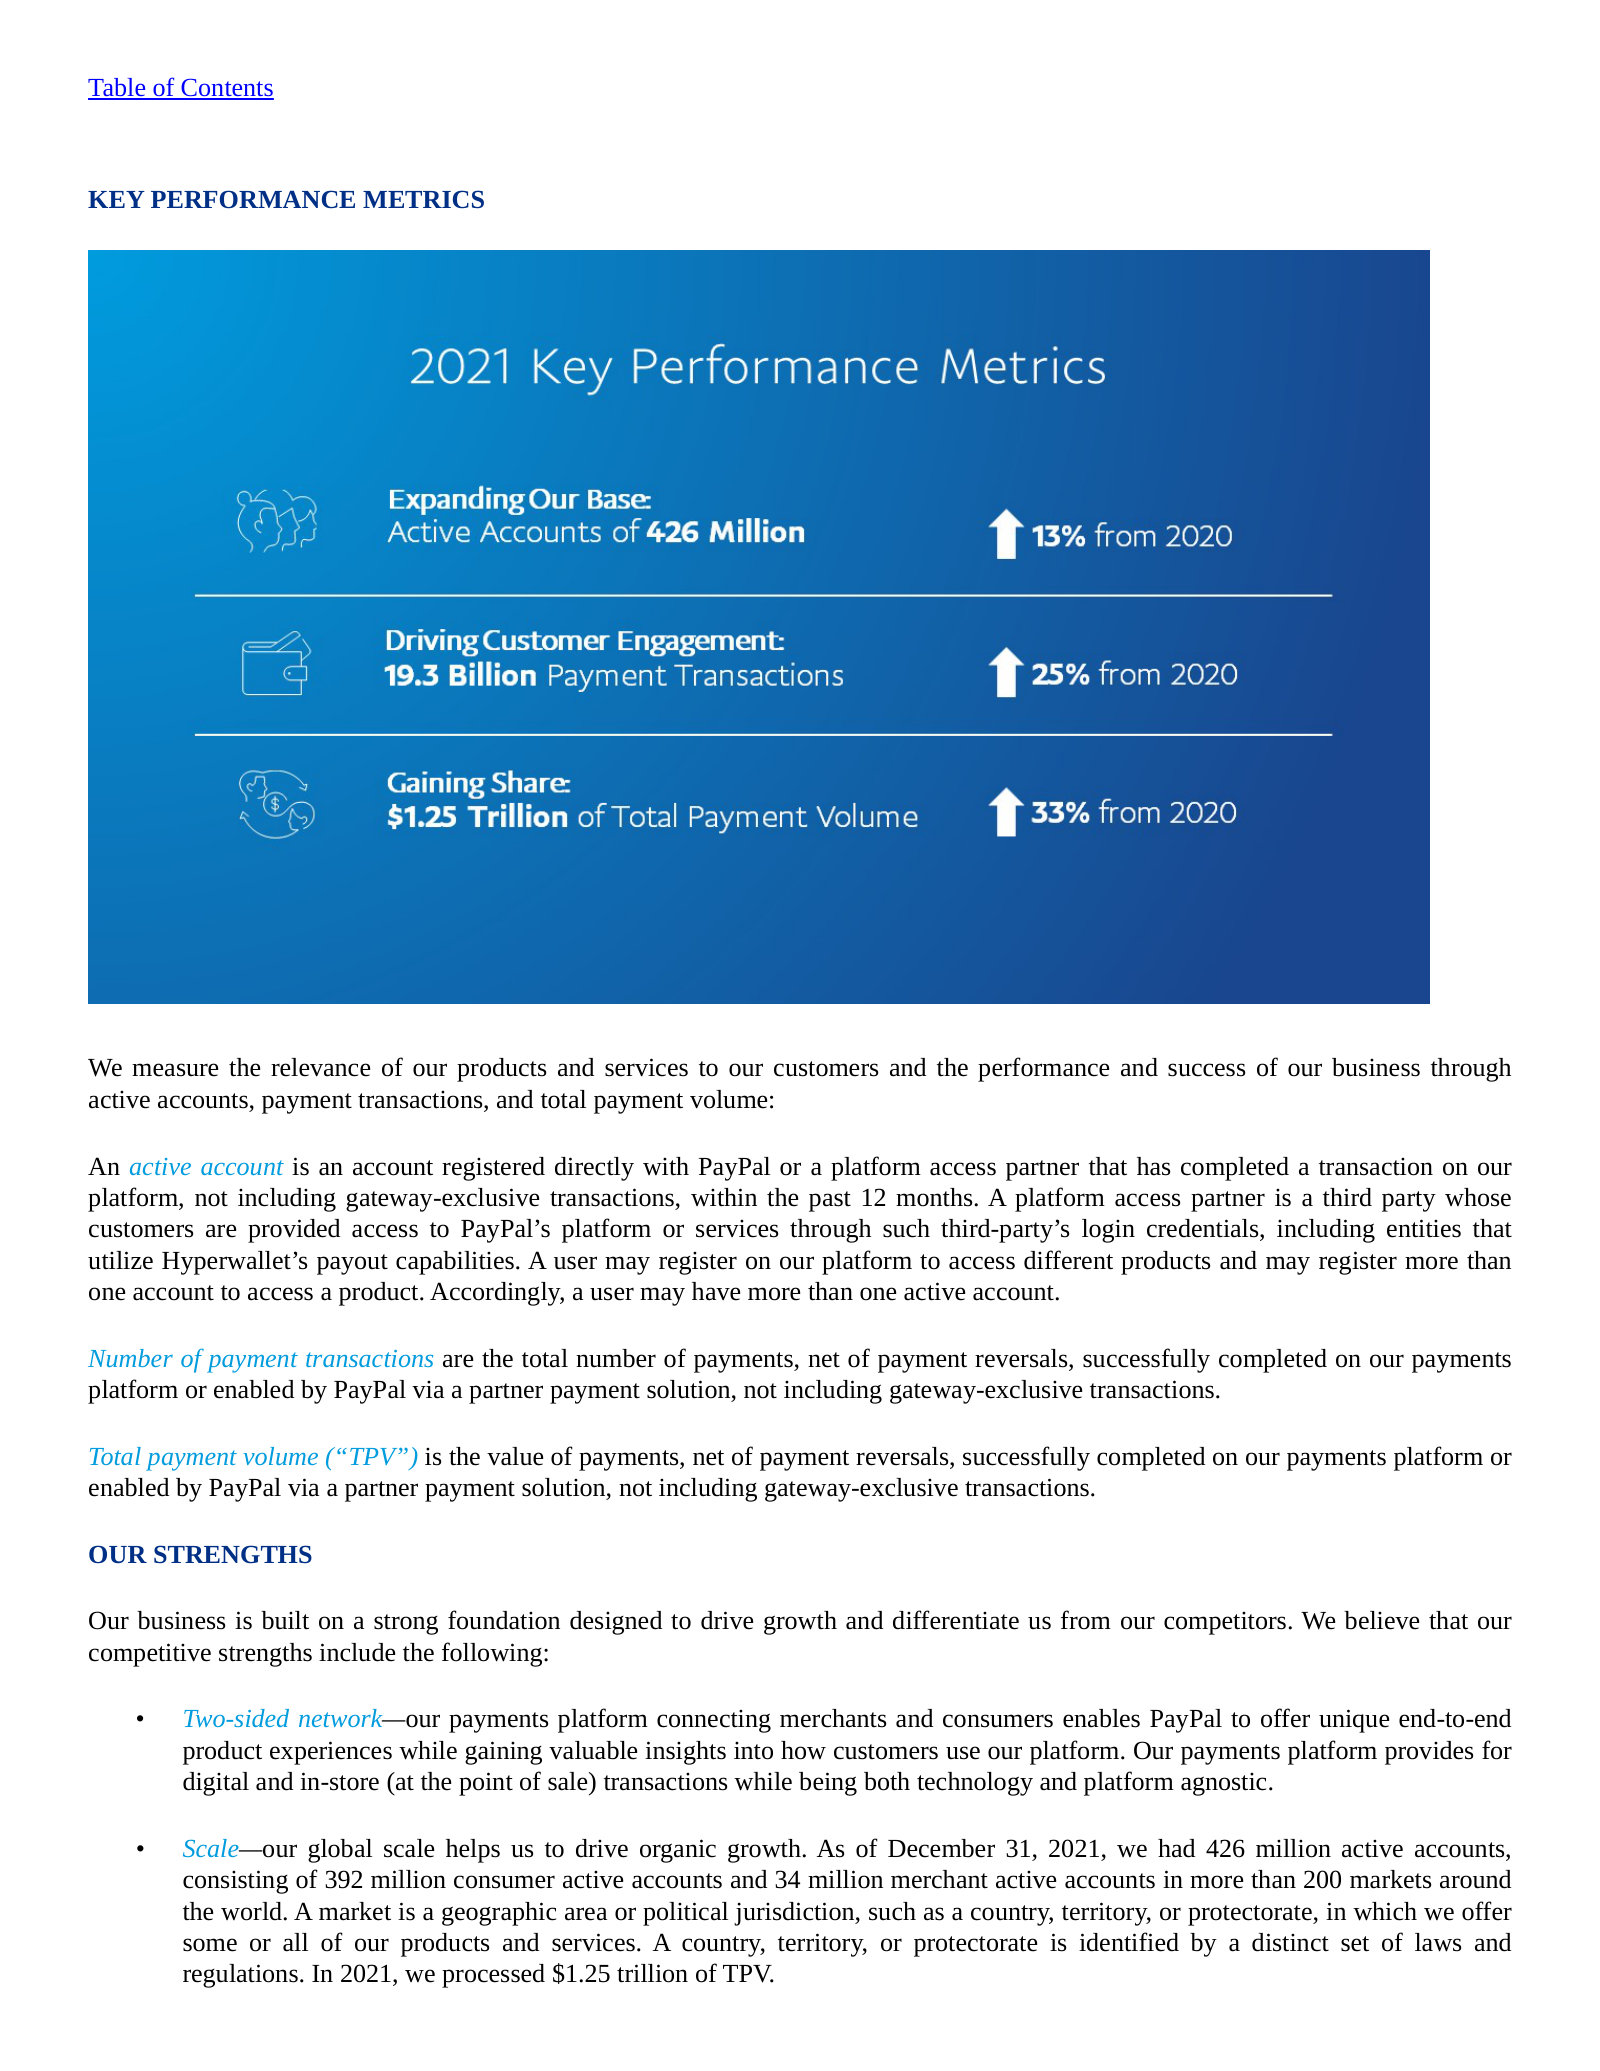
Item 1. Business — Key Performance Metrics — p. 8 · Read the full section →
The growth-at-all-costs scorecard — '+33% TPV, +25% transactions' — that makes FY2025's deliberate 4% transaction decline so striking.
More annual reports
PayPal Holdings, Inc. — FY2024 Annual Report (Form 10-K) — FY2024 (year ended Dec 31, 2024) · 177 pages · First full year under CEO Alex Chriss — the transition year where the profitable-growth strategy took hold. · Open →
PayPal Holdings, Inc. — FY2023 Annual Report (Form 10-K) — FY2023 (year ended Dec 31, 2023) · 183 pages · The leadership-change year, capturing the business just before the strategy reset. · Open →
PayPal Holdings, Inc. — FY2022 Annual Report (Form 10-K) — FY2022 (year ended Dec 31, 2022) · 191 pages · The post-COVID hangover year — decelerating growth that set up the eventual pivot. · Open →
Source: S&P Capital IQ consensus via Xpressfeed · Generated 2026-07-25.
Revenue and EPS both cut hard over 180 days — FY28 EPS -15%, revenue -8% — then flat the last 90
The downgrades are concentrated in the first half of the window; over the trailing 90 days both revenue and EPS have barely moved, suggesting the cutting cycle has paused rather than reversed.
Currency: USD · Scale: money in millions, absolute · Point-in-time consensus; Δ90d is Now versus 90d.
| Metric | FY | 180d | 90d | 30d | Now | Δ90d |
|---|---|---|---|---|---|---|
| EPS (normalized) | FY2027 | $6.45 | $5.79 | $5.76 | $5.75 | -0.7% |
| EPS (normalized) | FY2028 | $7.33 | $6.34 | $6.27 | $6.25 | -1.4% |
| Revenue | FY2027 | $37.32bn | $35.57bn | $35.79bn | $35.79bn | +0.6% |
| Revenue | FY2028 | $40.56bn | $37.26bn | $37.39bn | $37.35bn | +0.2% |
Beat / miss record
Current sequences by metric: Revenue: 1 consecutive beat; EPS (normalized): 1 consecutive beat.
Currency: USD · Scale: money in millions, absolute · Consensus is captured before each actual first became effective.
| Quarter | Metric | Consensus | Actual | Surprise | Outcome |
|---|---|---|---|---|---|
| Q1 FY2026 | Revenue | $8.05bn | $8.35bn | +3.7% | Beat |
| Q1 FY2026 | EPS (normalized) | $1.27 | $1.34 | +5.6% | Beat |
| Q4 FY2025 | Revenue | $8.79bn | $8.68bn | -1.3% | Miss |
| Q4 FY2025 | EPS (normalized) | $1.29 | $1.23 | -4.4% | Miss |
| Q3 FY2025 | Revenue | $8.23bn | $8.42bn | +2.2% | Beat |
| Q3 FY2025 | EPS (normalized) | $1.21 | $1.34 | +11.1% | Beat |
| Q2 FY2025 | Revenue | $8.08bn | $8.29bn | +2.6% | Beat |
| Q2 FY2025 | EPS (normalized) | $1.30 | $1.40 | +8.0% | Beat |
| Q1 FY2025 | Revenue | $7.84bn | $7.79bn | -0.6% | Miss |
| Q1 FY2025 | EPS (normalized) | $1.16 | $1.33 | +14.5% | Beat |
| Q4 FY2024 | Revenue | $8.28bn | $8.37bn | +1.1% | Beat |
| Q4 FY2024 | EPS (normalized) | $1.12 | $1.19 | +6.0% | Beat |
| Q3 FY2024 | Revenue | $7.89bn | $7.85bn | -0.5% | Miss |
| Q3 FY2024 | EPS (normalized) | $1.07 | $1.20 | +12.2% | Beat |
| Q2 FY2024 | Revenue | $7.82bn | $7.88bn | +0.8% | Beat |
| Q2 FY2024 | EPS (normalized) | $0.99 | $1.19 | +20.8% | Beat |
FY26 earnings pause, then normalized EPS climbs 8%+/yr on flat dollar earnings
Currency: USD · Scale: money in millions, absolute · YoY uses the prior fiscal year from the feed; analyst count and range use the first displayed period.
| Metric | FY2025A | FY2026E | FY2027E | FY2028E | YoY | Analysts | Low / high |
|---|---|---|---|---|---|---|---|
| Revenue | $33.30bn | $34.33bn | $35.79bn | $37.35bn | — | 41 | $33.07bn / $34.18bn |
| Net income (normalized) | $5.19bn | $4.70bn | $4.68bn | $4.71bn | — | — | — |
| EPS (normalized) | $5.35 | $5.31 | $5.75 | $6.25 | — | 44 | $4.94 / $5.46 |
| Gross margin | 46.4% | 44.8% | 43.8% | 42.7% | — | — | — |
Analysts split hard on FY28 earnings power: normalized EPS spans $5.32 to $7.35 across 24 shops
Currency: USD · Scale: money in millions, absolute · Spread/mean is absolute high-low divided by absolute mean.
| Metric | Period | Mean | Low–high | Spread/mean | Analysts |
|---|---|---|---|---|---|
| EPS (normalized) | FY2028E | $6.25 | $5.32–$7.35 | 32.5% | 24 |
| Revenue | FY2028E | $37.35bn | $35.64bn–$40.64bn | 13.4% | 26 |
| Net income (GAAP) | FY2028E | $4.66bn | $4.04bn–$6.09bn | 43.9% | 15 |
Street snapshot
The $147 high target sits far above the $50 median, so the mean is pulled well above where most of the coverage clusters.
Currency: USD · Scale: money in millions, absolute · Analyst counts shown explicitly.
| Street view | Reading | Analysts |
|---|---|---|
| Recommendation mix | Buy 6, Outperform 2, Hold 32, Underperform 0, Sell 3 | 43 |
| Consensus score | 2.81 | 43 |
| Target price | mean $53.07; median $50.00; high $147.4; low $32.00 | 33 |
FY2029 rests on a 1-3 analyst tail
FY2029 revenue reflects just 3 analysts, while EBITDA, GAAP net income and GAAP EPS are each carried by a single estimate — treat the outer year as indicative, not consensus.
Visible Alpha broker models via S&P Xpressfeed · 33 brokers · 501 line items · freshest revision 2026-07-24.
PayPal's broker models put the debate on unit economics, not the top line: total payment volume and transaction revenue rise steadily, but a mix shift toward low-take-rate unbranded (Braintree) volume compresses the transaction margin every year, leaving transaction-margin dollars roughly flat. Coverage is deep on the consolidated lines and much thinner on the segment splits.
Transaction margin compresses every year even as volume and revenue climb
Volume and transaction revenue rise across the forecast, yet transaction-margin dollars barely move because the blended take rate keeps stepping down. This is the wedge the models are pricing.
| Line | FY-2025A | FY-2026E | FY-2027E | FY-2028E | YoY | Brokers |
|---|---|---|---|---|---|---|
| Volume & revenue | — | — | — | — | — | — |
| Total payment volume (TPV)($B) | $1,787.78bn | $1,919.67bn | $2,034.10bn | $2,162.27bn | +7.4% | 32 |
| Transaction revenues | $29.92bn | $30.85bn | $32.08bn | $33.38bn | +3.1% | 31 |
| Margin | — | — | — | — | — | — |
| Transaction margin (Gross profit/loss) | $15.50bn | $15.33bn | $15.57bn | $15.77bn | -1.1% | 32 |
| Transaction margin(%) | 46.6% | 44.6% | 43.6% | 42.6% | -1.9pt | 33 |
| Transaction take rate as % of TPV(%) | 1.7% | 1.6% | 1.6% | 1.5% | -0.1pt | 32 |
Braintree (unbranded) is the volume engine, outgrowing Branded checkout
Unbranded Braintree volume is modeled to outpace Branded checkout, and it earns a take rate roughly half as high — so its faster growth mechanically dilutes blended economics and drives the margin fade in the prior table. Forward-year segment splits rest on few brokers; read the counts.
| Line | FY-2025A | FY-2026E | FY-2027E | FY-2028E | YoY | Brokers |
|---|---|---|---|---|---|---|
| TPV - Branded($B) | $497.56bn | $528.84bn | $549.64bn | $616.34bn | +6.3% | 10 |
| TPV - Braintree (Unbranded)($B) | $604.65bn | $698.57bn | $790.34bn | $788.42bn | +15.5% | 9 |
| TPV - Venmo($B) | $321.26bn | $364.01bn | $396.91bn | $415.25bn | +13.3% | 15 |
| TPV - eBay($B) | $29.44bn | $30.44bn | $31.27bn | $36.36bn | +3.4% | 12 |
Brokers split hardest on cash generation and account growth, not on revenue
Consensus on TPV and transaction revenue is tight; the real spread sits in free cash flow and how many net-new accounts PayPal adds. The transaction-margin row shows the crux metric is contested only modestly.
| Line | Period | Median | Q1–Q3 | Min–max | Brokers |
|---|---|---|---|---|---|
| Free cash flow | FY-2027E | $6.06bn | $5.62bn–$6.38bn | $3.90bn–$7.70bn | 24 |
| Net new active accounts in a year(M#) | FY-2027E | 4.00m Number | 3.04m Number–6.67m Number | 1.50m Number–12.26m Number | 17 |
| Transaction margin(%) | FY-2028E | 42.7% | 42.3%–43.2% | 40.5%–44.0% | 20 |
| TPV - Braintree (Unbranded)($B) | FY-2027E | $763.53bn | $739.01bn–$814.86bn | $733.02bn–$901.31bn | 4 |
Free cash flow funds roughly $6B of annual buybacks as spend-per-account rises
Steady free cash flow underwrites about $6B of repurchases a year, and revenue and volume per account keep climbing — the models lean on capital return and deeper monetization rather than margin expansion.
| Line | FY-2025A | FY-2026E | FY-2027E | FY-2028E | YoY | Brokers |
|---|---|---|---|---|---|---|
| Cash return | — | — | — | — | — | — |
| Free cash flow | $5.62bn | $5.41bn | $6.04bn | $6.26bn | -3.8% | 25 |
| Payment for repurchases of equity | $5.97bn | $6.04bn | $5.68bn | $5.43bn | +1.3% | 23 |
| Dividend Per Share($) | $0.13 | $0.55 | $0.60 | $0.63 | +309.0% | 11 |
| Per account | — | — | — | — | — | — |
| Revenue per customer account($) | $75.83 | $77.52 | $79.75 | $81.80 | +2.2% | 19 |
| TPV per customer account($) | $4,073 | $4,165 | $4,543 | $4,785 | +2.2% | 20 |
Segment splits rest on a handful of brokers
Consolidated lines (TPV, transaction revenue, transaction margin) carry 29–33 brokers, but the segment TPV and per-segment take-rate lines fall to as few as one broker in the out-years, so those splits are directional, not consensus. Revisions are current (mostly July 2026); the limitation is breadth, not vintage.
Headline P&L consensus, momentum and beat/miss live in the CapIQ tab.
Source: S&P Capital IQ transcripts via Xpressfeed · latest indexed call 2026-05-05 · generated 2026-07-25.
Latest call digest
PayPal Holdings, Inc., Q1 2026 Earnings Call, May 05, 2026 · 2026-05-05T12:00:00
Q1 2026 earnings call — May 5, 2026. This was Enrique Lores's first call as CEO, after Alex Chriss's exit and a brief interim period under CFO/COO Jamie Miller. The prepared remarks were less a quarter recap than a strategic reset: Lores framed his early observations (strong assets, years of technology underinvestment, too much organizational complexity), announced a reorganization into three lines of business — Checkout Solutions & PayPal, Consumer Financial Services & Venmo, and Payment Services & Crypto — and set a cost-savings target of "at least $1.5 billion of gross run rate savings over the next 2 to 3 years" from structural realignment plus AI adoption.
The Q&A reality was more sober than the reorganization optimism. Reported numbers were mixed: TPV accelerated to 11% at spot / 8% currency-neutral (over $460 billion), but online branded checkout TPV grew only 2% currency-neutral (up from 1% last quarter), transaction margin dollars ex interest grew 3%, and non-GAAP EPS rose just 1% to $1.34. Management reiterated full-year 2026 guidance but guided a notably weak second quarter — the toughest year-over-year comparison of the year — with transaction margin dollars down ~3% and non-GAAP EPS down roughly 9%. Quarter-to-date branded checkout was running at the low end of the full-year range, with softer travel and muted Europe. The clearest stated commitments were the $1.5 billion savings program and the reiterated 3-point investment headwind to transaction margin dollars.
Participant coverage from the latest call.
| Group | Participants | Count |
|---|---|---|
| Management | Operator; Steven Winoker — Chief Investor Relations Officer, PayPal Holdings, Inc.; Enrique Lores — President, CEO & Director, PayPal Holdings, Inc.; Jamie Miller — Chief Financial & Operating Officer and Executive VP, PayPal Holdings, Inc. | 4 |
| Analysts | Harshita Rawat — Senior Research Associate, Bernstein Institutional Services LLC, Research Division; Timothy Chiodo — Analyst, UBS Investment Bank, Research Division; James Faucette — MD & Equity Analyst, Morgan Stanley, Research Division; Darrin Peller — MD & Senior Analyst, Wolfe Research, LLC; Sanjay Sakhrani — Managing Director, Keefe, Bruyette, & Woods, Inc., Research Division; Jason Kupferberg — Managing Director & Senior Equity Analyst, Wells Fargo Securities, LLC, Research Division; Tien-Tsin Huang — Senior Analyst, JPMorgan Chase & Co, Research Division; Daniel Perlin — Analyst, RBC Capital Markets, Research Division; Bryan Keane — Research Analyst, Citigroup Inc., Research Division | 9 |
Curated latest-call exchanges; one row per analyst topic.
| Analyst | Firm | Topic | What changed in Q&A |
|---|---|---|---|
| Harshita Rawat | Bernstein | Branded checkout in Europe | Pressed on European weakness and realistic branded growth versus e-commerce; management cited macro softness, competitive intensity and market-leader normalization in the U.K. and Germany, and leaned on country-level execution. |
| Timothy Chiodo | UBS | $1.5B cost-savings program | Probed where the savings come from, flagging the large customer-support line as possible low-hanging fruit; management pointed to structural realignment plus AI in customer support and technology development. |
| James Faucette | Morgan Stanley | Reinvestment vs. capital return | Asked how savings will be split between reinvestment and buybacks and what KPIs would prove it; Lores deferred specific proof points and per-business KPIs to coming quarters. |
| Darrin Peller | Wolfe Research | Asset review / possible divestitures | Asked directly whether Venmo or Braintree could be sold; Lores said the plan is to keep and invest in all three core businesses, citing customer cross-sell, technology and risk synergies. |
| Sanjay Sakhrani | KBW | Second-half risk from fuel prices | Asked whether persistent higher fuel prices threaten the second half beyond the Q2 guide; Miller reiterated full-year guidance and pointed to easier comps ahead. |
| Jason Kupferberg | Wells Fargo | Checkout button rollout | Asked about progress on the fully optimized checkout button; Lores said 45% of non-vaulted customers now see the simplified pay experience but framed it as one lever among many. |
Theme tracker
Themes are curator-classified across supplied calls.
| Theme | Status | Quarters mentioned | Read-through |
|---|---|---|---|
| Online branded checkout turnaround | persisted | Q2 2023, Q4 2023, Q2 2024, Q3 2024, Q4 2024, Q1 2025, Q2 2025, Q3 2025, Q4 2025, Q1 2026 | The single most-discussed topic on every call for three years. Held mid-single-digit currency-neutral growth through 2024-mid-2025, then decelerated sharply to 1% in Q4 2025 before edging to 2% in Q1 2026 — the promised inflection has not arrived. |
| Venmo monetization | persisted | Q3 2023, Q1 2024, Q2 2024, Q3 2024, Q4 2024, Q1 2025, Q2 2025, Q3 2025, Q4 2025, Q1 2026 | A consistent bright spot — debit card and Pay with Venmo adoption drove revenue to roughly $1.7 billion in 2025, up about 20%; management repeatedly called it early-innings on ARPA. |
| Buy Now, Pay Later | persisted | Q4 2024, Q1 2025, Q2 2025, Q3 2025, Q4 2025, Q1 2026 | Sustained 20%+ TPV growth quarter after quarter; strategy shifted toward upstream presentment as a customer-acquisition channel. |
| PSP / Braintree price-to-value and value-added services | persisted | Q2 2023, Q4 2023, Q1 2024, Q2 2024, Q3 2024, Q4 2024, Q1 2025, Q2 2025, Q3 2025, Q4 2025, Q1 2026 | Multi-year reset accepting lower volume for higher margin; returned to double-digit enterprise volume growth by Q4 2025 with 16 monetized value-added services. |
| Fastlane guest checkout | dropped | Q4 2023, Q1 2024, Q2 2024, Q3 2024, Q4 2024 | Heavily promoted through 2024 as the unlock for the ~60% of checkout done as guest, with named merchant signings; effectively absent from the 2025-2026 calls, a notable disappearance for what was once a headline initiative. |
| Agentic commerce and AI platform partnerships | emerged | Q1 2025, Q2 2025, Q3 2025, Q4 2025 | Grew from an Investor Day aspiration to named OpenAI, Google and Perplexity partnerships; management consistently cautioned it is immaterial to 2026 growth. |
| Structural cost savings and AI transformation | emerged | Q1 2026 | Lores introduced a formal 'at least $1.5 billion' gross run-rate savings program over 2-3 years plus a dedicated AI transformation team — a step up from prior calls' generic efficiency language. |
| Multi-year Investor Day 2027 targets | dropped | Q4 2024, Q1 2025, Q4 2025 | The 8-10% branded checkout ambition set at the February 2025 Investor Day framed several 2025 calls, then was explicitly withdrawn on the Q4 2025 call, with the company reverting to one-year-at-a-time guidance. |
Guidance ledger
Quotes, calls, and speakers are source-verified; outcomes are curator-classified.
| Verbatim guidance | Call | Speaker | Curator outcome | Outcome note |
|---|---|---|---|---|
| “We now expect 2024 non-GAAP EPS to grow in the high teens and full year transaction margin dollars to increase by a mid-single-digit percentage.” | PayPal Holdings, Inc., Q3 2024 Earnings Call, Oct 29, 2024 · 2024-10-29T12:00:00 | Jamie Miller | kept | FY2024 non-GAAP EPS finished up 21%, above the high-teens guide. |
| “We expect to deliver full year non-GAAP EPS in the range of $4.95 to $5.10, representing about 8% growth at the midpoint.” | PayPal Holdings, Inc., Q4 2024 Earnings Call, Feb 04, 2025 · 2025-02-04T13:00:00 | Jamie Miller | kept | Initial FY2025 guide; full year finished at $5.31 after mid-year raises, above the range. |
| “We expect to deliver full year non-GAAP earnings per share in the range of $5.15 to $5.30, up 11% to 14%.” | PayPal Holdings, Inc., Q2 2025 Earnings Call, Jul 29, 2025 · 2025-07-29T12:00:00 | Jamie Miller | kept | FY2025 non-GAAP EPS of $5.31 landed just above the top of this range. |
| “We are raising our full year non-GAAP earnings per share guidance to a range of $5.35 to $5.39, growing at 15% to 16%.” | PayPal Holdings, Inc., Q3 2025 Earnings Call, Oct 28, 2025 · 2025-10-28T12:00:00 | Jamie Miller | missed | Per the Q4 2025 call, FY2025 EPS came in at $5.31 — $0.04 below the low end of this raised range. |
| “For 2026, we expect these targeted growth investments to represent approximately 3 points of headwind to TM dollar growth, while driving durable long-term benefits in the years ahead.” | PayPal Holdings, Inc., Q4 2025 Earnings Call, Feb 03, 2026 · 2026-02-03T13:00:00 | Steven Winoker | pending | 2026 investment headwind; reiterated on the Q1 2026 call. |
| “For the full year, we expect TM dollars to decline slightly or roughly flat excluding interest and customer balances, approximately 3% growth in nontransaction operating expenses and non-GAAP EPS ranging from down low-single digits to slightly positive.” | PayPal Holdings, Inc., Q4 2025 Earnings Call, Feb 03, 2026 · 2026-02-03T13:00:00 | Steven Winoker | pending | Full-year 2026 guide; reiterated on the Q1 2026 call. |
| “We expect to see at least $1.5 billion of gross run rate savings over the next 2 to 3 years.” | PayPal Holdings, Inc., Q1 2026 Earnings Call, May 05, 2026 · 2026-05-05T12:00:00 | Enrique Lores | pending | New cost program announced under Lores; cadence and reinvestment framework to be detailed later in 2026. |
Q&A pressure map
Question counts and firms are curator tallies; analyst coverage shown above.
| Topic | Questions | Firms | Pressure / response |
|---|---|---|---|
| Online branded checkout growth and Europe | 3 | Bernstein, Wells Fargo, Citi | The dominant pressure point on essentially every call. On the latest call three analysts pressed it directly; management attributed weakness to macro, competition and market-leader normalization in the U.K. and Germany rather than a single cause. |
| Cost-savings program execution | 2 | UBS, Morgan Stanley | Analysts pushed for specifics on the $1.5 billion target and how savings split between reinvestment and returns; management pointed to structural realignment and AI but deferred cadence and KPIs to coming quarters. |
| Portfolio strategy and possible divestitures | 2 | Wolfe Research, Wells Fargo | Asked in both Q1 2026 (Venmo/Braintree) and Q4 2025 (all options / asset sales); management consistently steered back to keeping and organically growing the three core businesses rather than answering the sale question head-on. |
| CEO transition and strategy continuity | 2 | JPMorgan, KBW | On the Q4 2025 call analysts sought assurance the leadership change was about execution, not a wholesale strategy reset; Miller stressed continuity and Enrique's prior board involvement. |
| Whether earnings can grow if branded checkout does not recover | 1 | Bernstein | Q4 2025 — Rawat questioned whether branded can be turned around at all; management leaned on Venmo, PSP and credit as diversified profit levers. |
Language shifts
Only language evidence verified against the referenced component is shown.
| Observation | Verbatim evidence | Call ID | Component |
|---|---|---|---|
| Peak-optimism framing from the prior CEO in the quarter just before the turn — a useful baseline for the confidence swing that followed. | “Put simply, this is the new PayPal, built for faster, more profitable growth.” | 1936997631 | 2 |
| A sharp move to candor on the Q4 2025 leadership-change call, explicitly conceding execution shortfalls. | “our execution has not been what it needs to be. We have not moved fast enough or with the level of focus required, and we are taking immediate steps to address that reality.” | 1977020531 | 2 |
| Management walked back its earlier confidence on the pace of the branded turnaround. | “we were too optimistic about how quickly we could drive change and customer adoption across a massive global user base.” | 1977020531 | 2 |
| Withdrawal of the multi-year targets — a concrete retreat from prior forward commitments. | “we are no longer committing to the specific outlook for 2027 we laid out at Investor Day last year.” | 1977020531 | 2 |
| The incoming CEO opened with realism about structural and operational problems rather than the acceleration language of prior calls. | “I'm also realistic that we need to make significant changes to improve the strategic and operational issues the company has faced.” | 1985919626 | 2 |
The last dozen calls document a turnaround that stalled: through two CEO changes in under three years the central branded-checkout question kept recurring and was never resolved, guidance that was beaten steadily in 2024 and mid-2025 was then missed on the Q3 2025 raise, and the tone shifted from growth-acceleration to cost-cutting and candor about execution. Diversified levers — Venmo, BNPL, PSP profitability — have carried earnings, but they are now offsetting a decelerating core rather than compounding on top of it.
Competitors describe PayPal Holdings, Inc.'s market in their own filings and calls. These verified passages and visual pages show where their strategies meet, using source documents preserved in Sources.
Block, Inc. (XYZ)
PayPal's most direct two-front rival: Cash App competes head-on with Venmo for consumer P2P and stored-value spend, while the Square seller ecosystem and Afterpay collide with Braintree/PayPal merchant processing and Pay Later BNPL.
Block's stated scale for Cash App, the direct Venmo rival — monthly transacting actives and total inflows, the consumer-network benchmark PayPal's Venmo is measured against.
As of December 2025, Cash App had 59 million monthly transacting actives across the United States. […] In 2025, Cash App transacting actives brought $316 billion in inflows into Cash App. In the fourth quarter of 2025, our Cash App monthly transacting actives brought in an average of $1,410 of inflows during the quarter.
p. 10 · Read in context →
Block sizes the Square seller ecosystem — its merchant-processing footprint that competes with PayPal's Braintree/unbranded acquiring — by sellers, transactions and gross payment volume.
In the year ended December 31, 2025, more than 4.5 million sellers used the Square ecosystem to make 5.9 billion individual sales transactions totaling $250 billion of Square GPV. These sales transactions originated from more than 800 million payment cards, across more than 300 million buyer profiles.
p. 8 · Read in context →
In its own risk factors Block names the fronts it fights on — banking-adjacent services and BNPL — the same categories where PayPal's wallet, Venmo debit and Pay Later collide with Cash App and Afterpay.
We compete with established banks, neobanks, and other financial technology companies that provide access to similar offerings […] We also compete in the BNPL market and a number of our competitors have introduced or offer BNPL products.
p. 36 · Read in context →
Adyen N.V. (ADYEN)
The purest enterprise-processing rival to PayPal's Braintree/unbranded business: a single global platform for online, in-store and in-app payments, expanding into embedded finance for software platforms — the exact ground PayPal's Commerce Platform contests.
Adyen's own description of its three commercial pillars — the Platforms pillar (embedding payments, capital and issuing into software providers) overlaps directly with PayPal's Braintree/Commerce Platform embedded-finance push.
We organize our commercial activities into three pillars. Digital supports onlinefirst enterprises such as subscription businesses, travel, and mobility. Unified Commerce connects online and in-person payments for global retailers, hospitality, and food & beverage groups. Platforms enables software providers to embed payments and financial services, including capital, issuing, and business accounts, into their offerings.
p. 9 · Read in context →
Adyen quantifies its enterprise processing scale and take rate for 2025, including a rising in-person (POS) share — the omnichannel reach it presses against Braintree/PayPal-unbranded.
Processed volume for 2025 was €1,394.3 billion, up 8% YoY. Of processed volumes, 84% were full-stack volumes, up from 83% in 2024. In 2025, our point-of-sale volumes were €310.9 billion, comprising 22% of total processed volume, up from 18% in 2024. […] Full-year take rate for 2025 was 17.0 bps, up from 15.5 bps in 2024.
p. 16 · Read in context →
Adyen's risk disclosure that large merchants deliberately split volume across multiple processors — the multi-PSP dynamic in which Adyen and PayPal's Braintree fight for share inside the same enterprise accounts.
Large enterprise customers typically have arrangements with multiple payment service providers (primarily in order to mitigate their single-point-of-failure risk). These customers could terminate their contracts or shift business away, leading to lower processed volumes and net revenue.
p. 55 · Read in context →
Visa Inc. (V)
The largest card network is both a rail PayPal rides and a competitor: Visa Direct chases the same P2P and disbursement flows as Venmo/PayPal, and Visa's own disclosures name PayPal directly while classing digital wallets as partner-and-competitor.
Visa names PayPal and Venmo directly — as Visa+ interoperability partners — illustrating how Visa is inserting its rails beneath the very P2P apps PayPal owns.
In addition, our Visa+ solution provides interoperability for our clients. In fiscal 2023, we announced the launch of Visa+, which enables transfers between participating P2P apps. Visa+ is now fully live for eligible users of PayPal and Venmo in the U.S.
p. 10 · Read in context →
Visa's stated scale for Visa Direct, the money-movement platform that competes with Venmo/PayPal P2P, payouts and settlements.
We have the largest money movement platform in the world — by transactions, volumes and endpoints […] In fiscal 2025, Visa Direct processed more than 12.5 billion transactions for more than 650 partners
p. 12 · Read in context →
Visa's 10-K competition language: the 'Alternative Payments Providers' category — closed ecosystems, BNPL and crypto/stablecoins — that PayPal and Venmo epitomize, with Visa's admission that such players are 'both a partner and a competitor.'
Alternative Payments Providers: These providers, such as closed commerce ecosystems, BNPL solutions and cryptocurrency platforms (including stablecoins), often have a primary focus of enabling payments through ecommerce and mobile channels […] In some cases, these entities can be both a partner and a competitor to Visa.
p. 19 · Read in context →
Mastercard Inc. (MA)
The other global network with the same frenemy relationship: Mastercard Move targets the disbursement and P2P flows Venmo/PayPal monetize, its filings class digital wallets as competitors, and management names PayPal directly as both issuing partner and competing wallet.
Mastercard's CEO names PayPal directly — as an expanded card-issuing partner and, in the same breath, a competing wallet operator launching contactless in Germany — capturing the coopetition at the heart of the relationship.
Michael Miebach, Chief Executive Officer: With PayPal, we extended our card issuing partnership in the United States. We also signed new credit and debit issuing agreements in the U.K. and Germany, and we are excited for PayPal's recently launched contactless mobile wallet in Germany.
p. 1 · Read in context →
Mastercard's competition disclosure describes PayPal's category without naming it — 'digital wallets and other fintechs… processing payments using in-house capabilities' — the online, in-house-processing model PayPal/Braintree runs.
The global payments industry is highly competitive. […] We compete against general purpose payments networks, debit and local networks, ACH and real-time account-based payments systems, digital wallets and other fintechs (focused on online activity across various channels and processing payments using in-house capabilities), digital public infrastructure and other government backed solutions and digital currencies.
p. 31 · Read in context →
Mastercard sizes the Move disbursements-and-remittances platform — the consumer and cross-border money-movement rails that overlap Venmo/PayPal P2P and payouts.
Through our Mastercard Move platform, we enable consumers, businesses, governments and merchants to send and receive money domestically and across borders to consumers with greater speed and ease, with a payout reach of more than 17 billion endpoints globally across multiple channels, and in more than 60 originating countries and 155 receiving countries
p. 13 · Read in context →
Apple Inc. (AAPL)
Apple Pay, Apple Cash and Tap to Pay ride a 2.5-billion-device installed base into the wallet, in-store acceptance and P2P layers PayPal and Venmo compete for — a distribution advantage no standalone wallet can match.
Apple ties an all-time revenue record in payment services to its 2.5-billion active-device base — the built-in distribution PayPal and Venmo must overcome to win wallet share.
Kevan Parekh, Chief Financial Officer: Our services revenue reached an all time high of $30 billion, up 14% year over year. As we said earlier, we had all-time revenue records on advertising, music, payment services, and cloud services […] With our installed base of over 2.5 billion active devices, we have an incredibly strong foundation for new growth opportunities
p. 4 · Read in context →
Apple's global expansion of Tap to Pay — turning iPhones into acceptance terminals in 50+ markets — presses on the merchant-acceptance turf PayPal and Venmo are extending into.
Kevan Parekh, Chief Financial Officer: And we continue to improve the quality and expand the breadth of our Services—from the expansion of features like Tap to Pay, now available in over 50 markets, to deeper support for enterprise customers.
p. 5 · Read in context →
Alphabet Inc. (Google) (GOOGL)
Google Pay/Wallet and Google's push to own the agentic-checkout surface (Universal Commerce Protocol, Buy with Google Pay) contest the branded-checkout and wallet layer PayPal monetizes — while, for now, partnering with PayPal on commerce.
Google describes moving into agentic checkout and names PayPal — as a partner in that build-out — signaling Google increasingly owns the checkout surface where PayPal is one option among many.
Philipp Schindler, President & Chief Business Officer: we also introduced new agentic checkout, which will let shoppers use like agentic AI to buy products from merchant sites and so on. We have a partnership with PayPal to help merchants build agentic commerce experiences.
p. 5 · Read in context →
Google positions Universal Card and 'Buy with Google Pay' to unify checkout across retailers and its owned surfaces — a platform-level move on the checkout layer PayPal's branded button competes for.
Philipp Schindler, President & Chief Business Officer: We also announced Universal Card, allowing shoppers to add items from different retailers across Google services and buy in a single checkout. […] With the launch of Buy with Google Pay, viewers can complete purchases directly on their CTV, turning the TV screen into a stronger performance surface.
p. 4 · Read in context →
More peer documents
Block Q4 FY2025 call — Afterpay/Cash App Pay BNPL and TAM — 13 pages · Block's own BNPL TAM framing (90 million U.S. BNPL users by 2026, volumes doubling by 2031) plus Cash App Pay +55% — the competitive backdrop for PayPal Pay Later. · Open →
Block Q2 FY2025 call — Cash App banking-actives monetization — 9 pages · Quantifies deep monetization of engaged Cash App 'banking' users (~$250 GP/active vs $87 blended ARPU) — the deposit/spend relationship Venmo is chasing. · Open →
Visa Q1 FY2026 call — Xoom on Visa Direct + stablecoin payouts — 14 pages · Visa cites PayPal's Xoom expanding cross-border on Visa Direct to 60+ markets and pilots stablecoin payouts — partner-dependency and PYUSD-overlapping ambition in one place. · Open →
Mastercard Q1 FY2026 call — account-to-account rails + digital assets — 12 pages · Mastercard pushing beyond cards into A2A rails and stablecoins — the same disintermediation-hedge turf PayPal is building toward. · Open →
Fit
Does not fit the framework (P1 not met); contested: X2, P2, P5
PayPal does not fit the framework. The year-10 durability gate (P1) does not hold cleanly, and that gate alone decides the outcome — nothing else offsets it. Confidence is low: the name-mask probe flipped one gate criterion (X2) and the load-bearing probabilities diverged across model families, which set the prior_driven_risk flag. Three criteria are contested — X2 (management-promotion pattern), P2 (adjusted-FCF consistency), and P5 (temporary-vs-permanent diagnosis). No exclusion is triggered and the name is inside the universe; it fails on durability conviction, not on a screen.
Universe and exclusions
The screens are clean. PayPal is a primary US listing — common stock on the Nasdaq Global Select Market under ticker PYPL, US-incorporated in San Jose — not an ADR and not a Chinese issuer, so the geography line (U1) is met [1]. Market cap is ~$54.4 billion (968M shares at $56.15), 5.4x the >$10 billion floor, and it held above the line even at the February 2026 trough (~$37.8 billion) — U2 met.
No exclusion hits. PayPal manufactures no vehicles, so the auto-OEM exclusion (X1) does not apply. It is the inverse of a consensus-saturated darling (X4): ~10x earnings, ~1.6x sales, down ~57% from its January 2025 peak, on a Hold consensus [2]. China is not a material sensitivity (S1 not triggered): cross-border TPV is 12% across all corridors and international revenue is led by sterling, euro, AUD, CAD and INR, with the only China reference a regulatory-jurisdiction mention. The management-promotion exclusion (X2) is contested rather than clean, and is treated in the pillar ledger below.
Market Cap ($B)
Drawdown from Peak
Adj. FCF Yield (FY25)
P(impairment temporary)
Source: market cap and drawdown derived from fit_features (968M shares × $56.15; peak $91.81); adjusted FCF yield derived from the FY2025 10-K cash-flow statement [3]; P(temporary) is the adversarial trial ruling.
Pattern match
This is a quality-tech-monopoly-on-a-fear-dip setup in shape — the fourth of the framework's four lenses — but it fails the lens's own first check. That pattern wants a monopoly or duopoly whose fear is specific and testable; PayPal instead competes in a fragmented, low-barrier payments market against banks, the card networks, Apple Pay, Google Pay, Adyen, Stripe and Block [4]. The fear is also specific and testable — branded-checkout disintermediation — but the market structure is not the protected franchise the pattern requires. Its 439-million-account, $1.79-trillion two-sided network is a real, partial offset that raises the cost of displacing it [5], but scale is not a franchise. The other three patterns — bank-at-the-bottom, high-dividend-yield, healthcare/insurance forecasting error — do not describe PayPal.
The pillar ledger
Source: the deterministic fit tally and the pillar claim ledgers; per-criterion arithmetic is page-cited in each pillar treatment below.
Year-10 gate (P1) — the decisive point
Here is the decisive point. Year-10 revenue clears the gate: consensus reaches $39.8B by 2029 against $33.2B in 2025, with no year of revenue decline on record [6]. Year-10 adjusted free cash flow higher, with very high conviction does not. In 2025 total payment volume rose 7% while transaction revenue rose only 3% and payment-transaction count fell 4% — the margin-bearing branded-checkout mix is eroding under trillion-dollar wallet competitors [7]. That is a proper doubt, and by the gate's own binary construction any proper doubt means it does not hold. The strongest counter-fact sits in the same breath: total FCF is not falling — reported FCF was $5.56B in 2025 and consensus holds it in a $5.2–6.5B band through 2029, on a net-cash balance sheet with a ~4%/yr buyback that lifts per-share FCF even if the total stays flat [8]. The gate needs both higher with very high conviction; revenue is yes, adjusted FCF is a genuine doubt. All four jurors, across both model families, read P1 not met (probability 0.555, spread 0.14).
Market structure is why the doubt is real: payments is fragmented and intensely competitive, not a monopoly, duopoly or regulated oligopoly, so year-10 durability rests on defending share rather than on a protected franchise [9]. The full treatment is in Durability.
FCF consistency (P2) — contested
On reported FCF the rolling five-year average rose steadily from ~$3.5B (through 2020) to ~$5.3B (through 2025) with no negative year — the consistency the framework wants. The adjusted-FCF version cannot be built: stock-based compensation is absent from the feature file for every year FY2016–FY2025, so the framework's real-FCF basis (FCF − SBC − 5-yr avg acquisitions) and its consistency series are one input short. That split is why P2 is contested — two jurors read it met on the reported proxy, two returned cannot-determine on the missing adjusted series. The counter-fact: annual FCF is genuinely volatile ($1.86B in 2017 to $6.77B in 2024), and because material SBC is not subtracted, the adjusted-FCF stability picture is unverified. Detail in Yield and Durability.
Dislocation and yield (P3) — the entry trigger is real; the price is not cheap enough
The dislocation is genuine and dated. On 3 February 2026 PayPal reported a modest Q4 miss, guided FY2026 non-GAAP EPS to a low-single-digit decline-to-slightly-positive (below Street), flagged branded-checkout weakness and replaced its CEO — a 20.3% single-day fall on 7.9x normal volume [10] [11]. P3a (dated trigger) and P3b (volume capitulation, 3.18x smoothed against the ≥2x line) are both met — see Dislocation.
Valuation is where the entry fails. FY2025 adjusted FCF of $4,009M (reported FCF $5,564M − SBC $1,002M − 5-yr-avg acquisitions $553M) is a 7.4% yield on the $54.4B market cap — 62 to 162 bps short of the 8–9% fortress reference line, so P3c is not met [12]. The counter-fact is inside the same treatment: removing only the rolled-off acquisition penalty (zero from FY2026, since 2022–2025 acquisitions were nil) lifts the same-price yield to 8.4%, just inside the band. The fortress classification that selects the 8–9% bar is itself a weakened claim — the supportable version is ~$11.7B total debt against ~$12.8B corporate cash and investments, roughly $1.2B net cash (−0.17x EBITDA), not the wider −0.68x the headline cash-and-investments basis implies. The forward path (P3d, probability 0.585, spread 0.06) is met but was also weakened on review: consensus forward FCF clears the bar after a ~$1.0B SBC haircut, but CapIQ's FCF definition runs ~$1B richer than PayPal's reported figure, which pushes the FY2026 adjusted proxy back toward 7.9% — at the threshold, not clearly above it. Workings in Yield.
Balance sheet and self-help (P4) — the strongest part of the case
PayPal can comfortably outlast the problem without capital allocation being forced toward debt paydown: net-cash, investment-grade, no debt maturity above $1.5B in any year, and a fully undrawn $5.0B revolver (P4a met) [13]. The repurchase engine is executed, not merely authorized: shares outstanding fell 20.5% over ten years (1,218M to 968M) on ~$6B/yr of actual buyback spend, with SBC declining so the reduction is genuine float retirement (P4b met) [14]. The counter-fact: every year's average repurchase price (2023–2025: $67.72, $65.55, $69.94) sat above today's $56.15, so prior buybacks bought above the current mark. The dividend (P4c) is not applicable — initiated October 2025 at ~1.0% yield, immaterial to the return case. Full treatment in Self-Help.
The management-promotion exclusion (X2) is contested and lives here. Across two CEOs PayPal set and then retracted three multi-year growth commitments — the 750M-account target (abandoned 2022), net-new-active guidance (dropped 2023) and the early-2025 investor-day outlook (withdrawn 2026) — amid three CEOs in ~2.5 years and negligible insider buying into the drawdown [15]. Against that, the one promise the self-help case turns on — ~$6B/yr of buyback — is kept literally, and near-term guidance is broadly met rather than serially missed (Q4 FY2025 missed the low end by $0.04) [16]. Two model families split on whether that is the framework's eHealth pattern (two read not-met, two read met), and the name-mask probe read it not-met — the divergence that drove confidence to low.
Diagnosis (P5) — contested, leaning permanent
The temporary-or-permanent question is decided by the adversarial trial, and it is contested. Three blind judges put the probability the impairment is temporary at 0.38 overall (individual reads 0.38, 0.38, 0.62), a 0.24 spread and a 0.12 order-effect gap — the panel leans permanent, not decisively, and one seat leans the other way. The damage arithmetic tracks that split: the market destroyed roughly $40B of value against a temporary-read NPV loss of only ~$2B (an apparent ~$38B mispricing), but that gap all but disappears under a permanent read whose central NPV loss of ~$30B nearly matches the price damage [17]. The impaired line is online branded checkout — about 30% of volume but over half of profit dollars — decelerating to 1–2% currency-neutral growth with take-rate compression to 1.62%; the sequential tick up to +2% in Q1 FY2026 with the US firming keeps a repricing recovery on the table [18]. Both cases are laid out in Damage Math.
Instrument context (I1) — not verifiable from the corpus
Listed options with 18-month-plus horizons exist (expiries to 21 January 2028) and 30-day implied volatility was ~47% as of 24 July 2026, below the framework's elevated line — so on instrument grounds the name would route to the book, not the watchlist. But the criterion is marked not verifiable: the expiry and IV facts are web-only (AlphaQuery), and a precise, dated open-interest figure could not be pulled from a citable source because the aggregator pages bot-wall automated access. The Clock tab carries the facts as dated web references. No trade structure, sizing or expression is recommended anywhere in this report.
What a 3x-in-3-years would require
The tally's re-rating block is unavailable: the note reads that re-rating math cannot be computed because the applicable bar or normalized adjusted FCF is missing (the deterministic fit_features.adjusted_fcf returned not_computable when SBC was absent from the cash-flow feed). The framework's target test can still be framed as arithmetic from the surviving Yield and Clock claims, clearly labeled as derived.
At the 8% fortress low, normalized adjusted FCF of ~$4.0B implies a market cap of ~$50B — essentially today's ~$54.4B. The entry price is roughly at the bar, not below it: there is no yield cushion to underwrite the return, which is the arithmetic behind P3c not being met. A 3x from $54.4B to ~$163B on ~$4.0B of normalized adjusted FCF would price that cash flow at a ~2.5% yield — a return to a growth multiple that requires branded-checkout re-acceleration and the reversal of the out-year reset (2027 consensus EPS was cut 10.9% and 2028 EPS 14.8%). Base rates from this name's own history bound the expectation: the four post-2022 drawdowns round-tripped +29% to +82% in 12–15 months, but none tripled, and the −82% fall from the 2021 peak has never recovered [19]. A re-recognition to a prior local high ($78–92, roughly +40% to +64%) sits inside those base rates; a 3x does not. See Clock.
Source: derived from the Yield adjusted-FCF computation and Clock base-rate episodes; re-rating block reported as unavailable per the fit tally.
Contested and undetermined
Three criteria are contested; nothing was left cannot-determine at the aggregate level.
- X2 (promotion pattern) — one family read the serial growth-target withdrawals plus low insider ownership as the exclusion pattern (not-met); the other weighed the literally-delivered buyback and broadly-met near-term guidance and did not trigger it (met). Vote split 2/2 across families; the name-mask read was not-met.
- P2 (adjusted-FCF consistency) — met on the reported-FCF proxy for two jurors; cannot-determine for two because SBC is absent from the feature file, so the adjusted series cannot be built. Recorded as contested rather than resolved.
- P5 (temporary vs permanent) — the trial ruling is 0.38 (leans permanent), spread 0.24, with one seat at 0.62. The report carries that probability, not a rounded verdict.
Provenance
Source: the fit tally provenance block and the skeptic refutations ledger.
The verdict was pressed hard. A four-seat jury drawn from two model families agreed on the P1 gate, and an independent skeptic re-computed the load-bearing claims — thirteen survived, two were weakened (the fortress net-cash measure and the forward-yield path, both narrowed rather than overturned), and none were refuted. The one soft spot is confidence, not direction: a name-mask probe that hides the ticker flipped the X2 read and the model families diverged on the load-bearing probabilities, so the framework flags prior_driven_risk and holds the tier at low.
The falsifier ledger
These are the standing what-would-change-this conditions. The first five are the framework's own templates; the rest are the name-specific tests, with the direction each would move the read and the window where defined.
- adjusted FCF or EBITDA declines where flat-or-better was underwritten
- revenue declines for a third consecutive year
- capital allocation pivots to debt paydown over repurchases
- share count inflects upward
- the industry repricing cycle fails to materialize where industry-wide mean reversion was underwritten
- Online branded checkout FXN growth returns to high-single-digits for 2+ consecutive quarters (first tests Q2/Q3 FY2026).
- FY26 actual transaction margin dollars grow mid-single-digit versus management's guided 'slight decline / roughly flat ex-interest'.
- Consensus 2027 non-GAAP EPS reverses the reset back above ~$6.45 and take rate stabilizes versus 1Q26's 1.62%.
- Online branded checkout TPV grows high-single-digit FXN for at least two consecutive quarters while transaction take rate is stable or rising versus 1Q26's 1.62%.
- FY2026 transaction margin dollars grow mid-single digits despite the planned investment headwind, instead of the guided slight decline or roughly flat ex-interest outcome.
- PSP, Venmo, debit, and agentic-commerce growth demonstrably produce transaction-margin-dollar contribution comparable to the lost branded-checkout flow-through.
- Management restores a credible multi-year growth outlook and consensus EPS/revenue estimates recover the prior out-year reset.
- Online branded checkout currency-neutral growth turns negative for two consecutive quarters (first tests Q2/Q3 FY2026) — moves ruling toward permanent.
- TM dollars ex-interest decline year-over-year in any FY2026 quarter (they grew 3% in Q1 FY2026) — toward permanent.
- Take rate compresses >10bps from pricing/disintermediation rather than mix (Q4FY24 decline was only -4bps on mix) — toward permanent.
- Consensus 2027 non-GAAP EPS drifts below FY2025's $5.31, or buybacks cut materially below ~$5B/yr — toward permanent.
Data gaps
What the run could not answer:
- Adjusted FCF is not computable in the feature file. The structured cash-flow feed shipped with no stock-based-compensation field and no acquisitions field, so
fit_features.adjusted_fcf,adjusted_fcf_yield,yield_baseline,fcf_stability,float_retirement_yearsandbalance_sheet_classall returned not_computable. Every component exists in the filed 10-K cash-flow and balance-sheet statements and was computed by hand from those primary pages; the derived figures are captioned as derived and the pivotal inputs page-cited. This is a data-plumbing gap, not an absence of the underlying numbers. - The adjusted-FCF stability series is truncated. The full acquisition-adjusted series is computable only from FY2023 forward, because the trailing five-year acquisition window reaches FY2019, the oldest year in the corpus; earlier years use a real-FCF (FCF − SBC) proxy.
- Short interest could not be measured over time. The FINRA reported-short feed returned zero rows; the level is web-verified and vendors disagree (~2.8% vs ~5.5% of float), so change through the drawdown is unmeasured.
- The estimate-revision feed spans only the trailing 180 days (snapshot 2026-01-26), so consensus cuts during the 2025 legs are not directly observable; the lead/lag read leans on roughly-flat forward EPS rather than a continuous series.
- No citable options open-interest. MarketChameleon and OptionCharts blocked automated access, so liquidity is stated only qualitatively and I1 is marked not verifiable.
- Enterprise value is approximate. With
balance_sheet_classnot computable, EV is approximated as market cap plus ~$2.0B consensus net debt. - No China line item and no independent branded-checkout share series. The immaterial-China conclusion rests on the absence of disclosure plus the 12% all-corridor cross-border figure; the take-rate wedge is the proxy for share erosion.
- Peer multiples and street context are from a dated web check, not the corpus — the Parallel web-research pipeline failed on billing, so those facts were gathered by direct search.
PayPal runs a two-sided digital-payments network — 439 million active accounts across ~200 markets, $1.79 trillion of payment volume in 2025, $33.2 billion of net revenue at a ~1.85% take rate [1]. It clears both universe lines: US-listed on Nasdaq, and a ~$54.4 billion market cap against the >$10B bar. It is not an auto-OEM and, down ~57% with a Hold consensus, it is the opposite of a consensus darling. The one caution for later tabs is structural, not a screen: this is a fragmented, low-barrier market, not a regulated oligopoly — the raw material the Durability tab has to weigh.
What PayPal sells, and how it earns
PayPal operates "a global, two-sided network at scale that connects consumers and merchants," carrying 439 million active accounts across roughly 200 markets at the end of 2025 [2]. It earns "primarily by charging fees for completing payment transactions … typically based on the volume of activity processed on our payments platform" [3]. The consumer side is checkout, the PayPal and Venmo wallets, branded debit and credit cards, buy-now-pay-later, and P2P transfers through PayPal, Venmo, and Xoom [4]. The merchant side is checkout acceptance, unbranded processing (Braintree), gateways, and small-business financing through PayPal Working Capital and PayPal Business Loan [5].
In two sentences a cold reader can carry: PayPal is a scaled digital-wallet and payment-processing network that sits between shoppers and online merchants, taking a small percentage of every dollar it moves. It monetizes that flow with transaction fees plus a growing layer of value-added services — currency conversion, instant transfers, crypto, interest and fees on consumer and merchant credit, and interest earned on customer balances [6].
Revenue is reported in two categories, and PayPal manages the whole company as one reportable segment — the CODM, its CEO, evaluates the business on consolidated net income [7]. Transaction revenue was $29.8 billion of the $33.2 billion FY2025 total; other value-added services, $3.4 billion and growing 14% [8].
Source: FY2025 Annual Report (Form 10-K), MD&A — transaction revenues and other value added services by year [9].
Scale and unit economics
The platform's scale metrics and the take rate they imply:
Source: FY2025 Annual Report (Form 10-K), Key Performance Metrics — total payment volume, payment transactions, and active accounts [10], and the Related Metrics table for transactions per active account and cross-border TPV [11].
The blended take rate — $33.2B of net revenue on $1.79T of TPV — computes to 1.85%; the transaction-revenue take rate alone is 1.66% [12]. The mix inside those numbers is the live story: volume grew 7% while transaction count fell 4% and transactions-per-account slipped to 57.7 from 60.6, as PayPal walked away from low-margin, high-transaction Braintree volume "as we focus on profitable growth" [13] [14]. Account growth has flattened to ~1% a year, so the engine is take-rate and engagement, not user acquisition.
Take rate = total net revenue ÷ TPV (33,172 ÷ 1,793,979); transaction take rate = 29,798 ÷ 1,793,979 — derived from FY2025 10-K figures.
Geography and profitability
Revenue is roughly 57% US, 43% international by customer domicile — $18.9 billion US against $14.3 billion elsewhere in FY2025 [15] [16]. About 37% of TPV is generated outside the US and 12% is cross-border, a ratio steady for three years [17]. International operations run mostly through a Singapore-licensed subsidiary, PayPal Pte. Ltd. [18]. The company employed ~23,800 people at year-end 2025, ~9,600 in the US [19]. FY2025 operating income was $6.1 billion at an 18% operating margin, and net income $5.2 billion — a mature, cash-generative profile, not a growth-stage burner [20].
Market structure — the P1 raw material
PayPal's own words set the frame: "The global payments industry is highly competitive, dynamic, innovative, and subject to regulatory scrutiny," and its business "faces competition from a wide range of businesses and from all forms of physical and electronic payments" [21]. The named categories of rival span banks and card issuers; the card networks; card processors and "card on file" services; digital wallets and mobile-payment solutions; BNPL and installment providers; real-time payment systems; P2P and remittance services; point-of-sale device makers; and stablecoin and distributed-ledger players [22]. The corpus peer set names the live threats concretely: Visa and Mastercard (the card-network duopoly PayPal rides on and competes with at the wallet), Apple Pay and Google Pay at mobile checkout, Adyen and Block/Square in merchant acquiring.
This is the single most important fact the durability question inherits, so it is worth stating plainly. PayPal is not a monopoly, duopoly, or regulated oligopoly. It is a large, scaled participant in a fragmented, intensely competitive market with comparatively low structural entry barriers — the opposite of the bank/insurer/utility structure that gives Ruchir's framework its year-10 conviction. PayPal even flags that some competitors "are or may be larger than we are, have larger customer bases, greater brand recognition … or a dominant or more secure position," while others are "smaller or younger companies that may be more agile" [23]. "Your margin is my opportunity" is a live risk here, not a hypothetical.
Three facts push the other way, and the Durability tab will weigh them:
- Scale and a two-sided network. 439 million accounts and $1.79 trillion of annual volume are not trivially replicated; the network draws value from data on both sides of every transaction [24].
- Regulatory perimeter as a partial moat. PayPal holds payment and money-transmission licenses across many jurisdictions and is supervised by regulators including the Luxembourg CSSF, the UK FCA, the Monetary Authority of Singapore, and the Reserve Bank of India [25]. This raises the cost of entry but does not confer a franchise the way an insurance or banking charter does.
- Essential product, long-lived brand. Digital payments are not going away, and the PayPal brand has operated since 1998; the company has been a standalone public company since its July 2015 spin-off from eBay. The framework question is not whether digital payments survive to year 10 — they will — but whether PayPal's share and take rate do.
The honest read for P1: revenue and FCF are large and the product is essential, but market structure supplies durability doubt, not durability conviction. That tension is the Durability tab's to resolve; it is flagged here, not settled.
The universe screen
Both lines clear, and cleanly:
| Screen | PayPal | Line | Result |
|---|---|---|---|
| U1 — Geography / instrument | Common stock, Nasdaq (ticker PYPL); US-incorporated, San Jose HQ | US-listed, or European co. with US ADR; no Chinese ADR | Clears |
| U2 — Market cap | ~$54.4B (968M shares × $56.15, 24 Jul 2026) | > $10B | Clears |
Source: identity from company profile; market cap from the deterministic feature file (fit_features.market_cap_usd), FY2025 shares outstanding × 24 Jul 2026 close.
PayPal common stock is quoted on the Nasdaq Global Select Market under the ticker "PYPL" [26] — a primary US listing, not an ADR, not a Chinese issuer — so the geography screen is a single calm pass. Market cap of ~$54.4 billion sits comfortably above the $10 billion floor, and did so throughout the drawdown (even at the February 2026 trough of ~$39, the cap was ~$40B). A dated web check on 25 July 2026 corroborates the order of magnitude and the current tape: PayPal trading in the high-$40s to mid-$50s with a market cap in the ~$49–61 billion range across data vendors.
First-pass exclusion screen
X1 — Auto-OEM: clears (not applicable). PayPal manufactures no vehicles; it is a payments-technology company. No exposure.
X4 — Consensus-saturated darling: clears, decisively — the pattern is inverted. A darling trades on an extreme multiple with the whole sell side onside and a bottom-left-to-top-right chart. PayPal is the mirror image. At ~$54.4B on $5.2B of FY2025 net income and $33.2B of net revenue, it trades at roughly 10x earnings and 1.6x sales — a fraction of Visa's or Mastercard's ~30x P/E. The chart is top-left-to-bottom-right: down ~57% from its January 2025 peak of $91.81 to a February 2026 trough of $39.08, and ~80% below its 2021 all-time high near $300. Analyst sentiment is tepid, not euphoric — a Hold consensus (roughly 8 Buy / 31 Hold / 5 Sell across ~44 analysts on a dated 25 July 2026 web check), average target ~$64. Consensus does not own this story; consensus has left it. That is a screen PayPal passes by being unloved, which is the condition Ruchir hunts for — though whether the fear is deserved is the work of Damage Math and Durability, not this tab.
P/E and P/S derived from fit_features market cap ($54.4B) ÷ FY2025 net income ($5.2B) and net revenue ($33.2B); drawdown from fit_features.capitulation_gauge; peer multiples and consensus from a dated web check, not the corpus.
S1 — China dependence: immaterial. PayPal discloses no China revenue or asset concentration. The only China reference in the business record is that the People's Bank of China "asserted jurisdiction over some or all of our activities" — a regulatory-perimeter mention, not a revenue dependency [27]. Total cross-border TPV is 12% of the whole across all corridors, and international revenue (43%) runs mostly through currencies led by the British pound, euro, Australian dollar, Canadian dollar, and Indian rupee [28]. China is not a sensitivity worth flagging.
Two exclusion checks belong to other tabs and are not adjudicated here. The promotional-CEO test (X2) — ownership and promise-versus-delivery across the transcript archive — is Self-Help's. The structural-decline test (X3) — whether the recent revenue and transaction softness is temporary or a durable erosion — is the trial's question in Damage Math and the Durability tab's. One fact worth carrying forward without prejudging either: share count has fallen every year since 2021, from 1.19 billion to 968 million, on a steady buyback — capital allocation that already points toward the flywheel the framework prizes, examined in Self-Help.
Bottom line. This is a real dislocation, not drift. PayPal fell 57.4% from a 17 Jan 2025 close of $91.81 to a 12 Feb 2026 low of $39.08 — a 391-day, multi-leg slide — while forward earnings power barely moved. The decisive event leg is 3 Feb 2026: a Q4 FY2025 miss, a below-Street 2026 guide, and an abrupt CEO change together took the stock down 20.3% on 141M shares, the second-heaviest volume day in its history. The price fall dwarfs the estimate cut.
Numbers of record: fit_features.capitulation_gauge. Price and volume: data/prices/daily.json, data/tech/unusual_volume.json. Estimates: data/sp/estimates.json.
The drawdown, quantified
The capitulation gauge is the source of record: peak $91.81 on 17 Jan 2025, trough $39.08 on 12 Feb 2026, a −57.4% fall over 391 days; the last close in the window is $56.15 on 24 Jul 2026, leaving the stock ~44% above the low but still ~39% below the peak. The 52-week range runs $39.08 to $78.51, and the current price sits at the 43rd percentile of it.
Month-end closes with the exact peak and trough dates overlaid; derived from data/prices/daily.json.
The fall came in identifiable legs, not one drop:
| Leg | Window | Move | Volume day | What it was |
|---|---|---|---|---|
| 1 | 4 Feb 2025 | −13.2% ($89.51→$77.72) | 58.8M (6.5× 50d) | Q4 FY2024 beat, but soft 2025 guide |
| Drift | Feb–Apr 2025 | ~$71 → $56.67 low | normal | 2025 tariff-macro selloff; death cross 2 Apr 2025 |
| Bounce | May–Jul 2025 | $56.67 → $78.51 | — | recovery to the year's high |
| 2 | 29 Jul 2025 | −8.7% | 42.9M | Q2 FY2025 print |
| Grind | Aug 2025–Jan 2026 | $78 → $52.69 | mixed | steady de-rating |
| 3 (capitulation) | 3 Feb 2026 | −20.3% ($52.33→$41.70) | 141.2M (7.9× 50d) | Q4 FY2025 miss + weak 2026 guide + CEO change |
Single-day moves and volumes from data/prices/daily.json and data/tech/unusual_volume.json.
The trigger
The event leg is 3 Feb 2026, when PayPal reported Q4 and full-year 2025. The quarter itself was a small miss — revenue $8,676M (+4% Y/Y) and non-GAAP EPS $1.23 (+3%), against roughly $8.79B and $1.29 of consensus [1]. Three things landed together and did the damage:
- Guidance below the Street. FY'26 was guided to non-GAAP EPS "low-single-digit decline to slightly positive" off the FY'25 base of $5.31, with transaction-margin dollars in "slight decline" and 1Q'26 EPS a "mid-single-digit decline" [2]. Consensus had FY'26 EPS closer to the high-$5 area, so the guide read as a cut, not a hold.
- The core decelerated. Management said results were "pacing below our expectations, primarily within branded checkout" — the profit engine — even as Venmo revenue grew ~20% to $1.7B [3].
- The CEO was replaced. The board named HP's Enrique Lores president and CEO effective 1 Mar 2026, saying the pace of execution under Alex Chriss "was not in line with its expectations." A leadership change stapled to a guidance cut removed the turnaround premium the 2024 rally had built.
The market reaction was immediate: −20.3% on the day, 141.2M shares — 7.9× the 50-day average and the second-largest volume day in PYPL's history behind the February 2022 collapse. The trough followed nine sessions later at $39.08.
This is distinct from the earlier legs. Leg 1 (Feb 2025) was itself event-driven — a soft 2025 guide against a Q4 FY2024 beat — but the February–April 2025 decline into the mid-$50s carried no single catalyst and tracked the broad tariff-macro selloff; that stretch is drift. The February 2026 leg is the moment fear repriced the stock.
The fear gauge
The capitulation gauge measures the volume spike as 3.18× — the maximum 20-day average volume within the peak-to-trough leg divided by the median daily volume over the 180 days before the peak. That is elevated but not extreme on a smoothed basis, which fits the shape of the fall: a long grind punctuated by two violent days rather than a single blow-off. The emotion was concentrated on the event days themselves — the 3 Feb 2026 session alone traded 141M shares at 7.9× its 50-day average, and the 4 Feb 2025 leg traded 58.8M at 6.5×. Both are the fingerprints of forced, emotion-driven selling clustered on the catalyst, not orderly repricing spread across the tape.
Who was selling
Not shorts. The short-interest feed returned zero reported rows for PYPL, so the level is web-verified rather than corpus-sourced: roughly 2.8%–5.5% of float (about 27M–43M shares) across data vendors — light for a mega-cap and low relative to average daily volume. This was not a short-driven decline, and there is no crowded short to unwind.
Not forced structural sellers. PayPal remained an S&P 500 and Nasdaq-100 constituent throughout; there was no index deletion, and the corpus and web research surface no disclosed fund liquidation. The holder base is anchored by large passive owners (Vanguard, BlackRock) and legacy eBay-era holders.
Long-side capitulation, with one insider leaning in. The 141M-share day reads as panic selling by long holders after the CEO ouster and guidance cut. Insider activity during the drawdown was routine: 40 open-market sales totaling ~178k shares, mostly option-driven executive dispositions, against a single open-market purchase — CFO Jamie Miller bought 6,129 shares at $41.53 on 15 Jun 2026 (~$0.25M), near the lows. That is a modest confirming signal, not a wave of insider buying.
Estimates vs price — the signature
The framework's tell is a price fall that outruns the estimate cut, and PayPal shows it plainly. Over the full drawdown the price fell 57.4% while delivered and forward earnings held: FY'25 non-GAAP EPS came in at $5.31, up 14% for the year [4], and consensus forward EPS is roughly flat-to-rising from there (FY'26 $5.31, FY'27 $5.75, FY'28 $6.25).
The estimate cut that did occur lagged the price. The revision feed only carries the trailing 180 days (snapshot dated 26 Jan 2026, days before the Q4 report). Over that window consensus FY2028 EPS was marked down $7.33 → $6.25 (−14.7%) and FY2028 revenue $40.56B → $37.35B (−7.9%) — yet the price over the same span went from ~$52.69 to $56.15, roughly flat. In other words, ~43% of the price damage (peak to the $52.69 January-2026 level) was already done before analysts cut the out-year numbers; the ~8–15% estimate reduction then landed with the capitulation while the price held. The magnitudes are not close: a mid-single-digit-to-15% cut to forward estimates against a 57% price fall.
That gap also shows up in cash-flow yield. On current market cap of $54.35B, consensus FCF puts the FY2026 forward FCF yield at 10.7% and FY2025 at 12.1% (fit_features.consensus_forward_yield) — a level that exists because the price collapsed against cash generation that did not. Whether that gap is a temporary mispricing or a permanent re-rating is not this tab's question; the Damage Math tab and the trial take it up. What this tab establishes is narrow and factual: something identifiable went wrong on 3 Feb 2026, fear repriced the stock far harder than the numbers moved, and the sellers were long holders capitulating rather than shorts or forced structural exits.
Damage Math
PayPal's per-share price fell 57% from its January 2025 peak to the February 2026 trough and sits 39% below peak today, erasing roughly $40 billion of market value. Near-term earnings barely moved: FY2026 consensus EPS is flat and revenue still grows about 3.5%. The destruction is in the out-years — 2027–2028 consensus EPS was cut 11%–15%. Whether that reset is temporary or permanent is what decides if a gap exists; the trial panel put the probability it is temporary at 0.38, and split.
The near-term hit — a small numerator
The trigger was the Q4 FY2025 print on February 3, 2026: non-GAAP EPS of $1.23 missed consensus by 4.4%, revenue of $8.68 billion missed by 1.3%, management guided 2026 EPS "flat-to-down versus 2025's $5.31," and the board replaced CEO Alex Chriss with Enrique Lores the same day [1]. None of that is a collapse in current earning power. GAAP net income actually rose from $4,147 million (FY2024) to $5,233 million (FY2025), and diluted EPS from $3.99 to $5.41, on operating income up from $5,325 million to $6,065 million [2].
FY2026 Revenue vs FY2025 (consensus)
FY2026 Norm. EPS vs FY2025 (consensus)
Q4 FY2025 EPS Surprise
Source: consensus estimates (FY2026 revenue $34.3B vs FY2025 actual $33.2B; FY2026 normalized EPS $5.31 vs FY2025 actual $5.31; Q4 FY2025 normalized EPS $1.23 vs $1.29 consensus); FY2025 actuals per the FY2025 10-K [3].
The real move in the estimate record is one year further out. Between the 180-day-ago vintage (before the trigger) and now, consensus normalized EPS was cut 10.9% for 2027 ($6.45 to $5.75) and 14.8% for 2028 ($7.33 to $6.25); the revenue line was cut 4.1% for 2027 and 7.9% for 2028. That is the numerator that matters — not the flat 2026, but a lower long-run slope.
Source: consensus estimate revisions, 180-day vintage vs current (data feed: data/sp/estimates.json momentum series).
The price and value change over the same window
Per-share price fell from $91.81 (January 17, 2025) to $39.08 (February 12, 2026), a 57.4% drawdown, and has since recovered to $56.15 (July 24, 2026) — still 39% below peak. Translated to enterprise value: market cap fell from roughly $95.4 billion at peak (1,039 million shares at year-end FY2024) to about $37.8 billion at the trough (968 million shares), and stands at $54.4 billion today [4]. Corporate net debt is modest (consensus FY2025 net debt near $2.0 billion), so EV tracks market cap closely. The buyback retired 7% of the float in FY2025 — $6,052 million of repurchases against $5,564 million of free cash flow ($6,416 million operating cash flow less $852 million of capital expenditure) — so total-cap destruction (43% peak-to-today) slightly exceeds the per-share move because the share base shrank [5].
Source: derived — price series peak/trough/current (drawdown gauge, fit_features.capitulation_gauge) times shares outstanding near each date (fit_features.share_count_trend); share and buyback figures per the FY2025 10-K cash-flow statement [6].
Stated side by side: consensus 2027–2028 EPS fell 11%–15% and the long-run revenue slope fell about 4 points; the market cap fell 43% from peak (57% at the trough). The question is whether a 4-point slope cut can arithmetically justify a 43% value cut.
The NPV arithmetic, in two scenarios
The workings are deliberately simple and reproducible. Take a normalized free-cash-flow base of $6.0 billion — between FY2025 reported FCF of $5.56 billion and the FY2026–2028 consensus band of $5.8–6.5 billion. (On an owner-earnings basis this base is lower: reported FCF does not deduct the $1.0 billion of stock-based compensation charged in FY2025, which the Yield tab carries; the level scales both scenarios below equally, so it does not change the gap logic.) Value a growing perpetuity with the Gordon formula, V = FCF × (1 + g) / (r − g), and ask what the near-term hit does to g.
Temporary scenario. Long-run growth is unchanged; the hit is one-to-two years of flat FCF while management reinvests, then the prior trend resumes. FY2026 consensus FCF of about $5.8 billion sits roughly $0.7 billion below a $6.5 billion trend. Two years of a ~$0.7 billion shortfall, discounted at 9%, destroys about $1.2 billion of NPV; stretch it to three years and it is under $2 billion. Call the temporary NPV damage $1–3 billion.
Permanent scenario. The near-term hit reflects a durable reduction in the long-run growth rate — branded checkout, over half of profit dollars, decelerating from mid-single digits toward 1%–2% and being diluted by lower-yield volume. Model that as a cut in g and read the NPV loss off the table below.
Source: derived — Gordon growth model on a $6.0B normalized FCF base; NPV hit = FCF×(1+g_pre)/(r−g_pre) − FCF×(1+g_post)/(r−g_post). Values are sensitive as g approaches r; an r=8% column (not shown) roughly doubles each figure.
A permanent 1.5–2.0 point growth cut destroys roughly $22–45 billion of NPV, centering near $30 billion at a 9%–10% discount rate. That is comparable to the $40 billion the market cap has lost from peak and within reach of the $57 billion peak-to-trough stress.
The gap depends entirely on the diagnosis. If the impairment is temporary (NPV damage ~$2 billion), the market destroyed roughly $40 billion of value against ~$2 billion of plausible NPV loss — a gap near $38 billion, a large apparent mispricing. If it is permanent (central NPV damage ~$30 billion), the gap narrows to roughly $10 billion, inside the model's error band — no reliable mispricing.
Source: derived — price damage from market-cap change above; NPV hits from the temporary and permanent scenarios in this section.
The trial, both sides at their strongest
The temporary-versus-permanent question was argued by two opposing corpus-cited briefs and ruled on by three independent judges.
The ruling is contested. The three judges put the probability the impairment is temporary at 0.38 overall — individual reads of 0.38, 0.38, and 0.62 — with a spread of 0.24 between the extreme seats and a 0.12 order-effect gap between reading sequences. The panel leans toward the permanent reading, but not decisively, and one seat leans the other way. The diagnosis the report carries is that 0.38, not a rounded-up verdict. What would move it toward temporary: online branded checkout returning to high-single-digit currency-neutral growth for two-plus consecutive quarters (first tested at Q2/Q3 FY2026), FY2026 transaction-margin dollars growing mid-single digits against the guided flat-to-down, and 2027 consensus EPS reversing back above roughly $6.45. What would move it toward permanent: branded checkout turning negative, transaction-margin dollars declining year-over-year, or take rate compressing more than 10 basis points on price rather than mix.
Which line broke, and whether it self-corrects
The driver behind the hit is specific: online branded checkout, roughly 30% of volume but more than half of profit, decelerating to 1%–2% currency-neutral growth [17] [18]. The bull mechanism of recovery is repricing and product: management is reinvesting in a checkout experience it concedes was "stagnant and underinvested," and Q1 FY2026 showed a sequential improvement to +2% with the U.S. firming [19] [20]. The bear mechanism against it is structural and embedded: a decade of take-rate compression (to 1.62%) as growth migrates to lower-yield PSP and Venmo volume, and a management team that withdrew its own multi-year outlook because the underlying assumptions did not hold [21] [22]. Both mechanisms are live in the record; the Durability tab weighs which dominates, and the Dislocation tab anatomizes the drawdown itself.
Yield
On adjusted free cash flow — reported FCF minus stock-based compensation minus the trailing five-year average of acquisition spend — PayPal generated about $4.0 billion in FY2025, a 7.4% yield on its $54.4 billion market cap. The balance sheet is a fortress (net cash), so the reference line is the 8–9% fortress bar: the name sits roughly 62–162 bps short on trailing figures, and clears the 8% low once the lagging Honey/Paidy acquisition penalty rolls off. Consensus forward FCF clears the bar unadjusted; the SBC haircut brings it back to the threshold.
The deterministic feature file could not compute adjusted FCF, its yield, the baseline, or the balance-sheet class: the structured cash-flow feed shipped without a stock-based-compensation field, so every downstream derivation returned not_computable. The figures below are built from the filed 10-K cash-flow and balance-sheet statements, which carry all the components in full. Each computed series is captioned as derived; each pivotal number is anchored to its filed page.
The adjustment, line by line
Adjusted FCF strips two things the reported number flatters: stock-based compensation, which is a real economic cost paid in dilutable shares, and a smoothed measure of acquisition spend, which penalizes growth bought rather than earned. PayPal's stock-based compensation has run near $1.0–1.5 billion a year, and its acquisition spend collapsed from the Honey ($3.6 billion, 2020) and Paidy ($2.8 billion, 2021) era to essentially zero across 2022–2025 [1] [2].
Adjusted FCF = reported FCF − SBC (cash-flow-statement add-back) − trailing five-fiscal-year average acquisition spend; derived from the filed cash-flow statements. The five-year acquisition window is complete only from FY2023 (it reaches FY2019, the oldest year in the corpus); earlier adjusted rows are left blank rather than computed on a truncated window. Sources: FY2025 10-K [3]; FY2022 10-K [4]; FY2021 10-K [5].
The workings for the three complete years:
- FY2023: $4,220M − $1,475M SBC − $1,288M acquisitions (2019–2023 avg of 70, 3,609, 2,763, 0, 0) = $1,457M.
- FY2024: $6,767M − $1,230M SBC − $1,274M acquisitions (2020–2024 avg of 3,609, 2,763, 0, 0, 0) = $4,263M.
- FY2025: $5,564M − $1,002M SBC − $553M acquisitions (2021–2025 avg of 2,763, 0, 0, 0, 0) = $4,009M [6].
The acquisition line is the moving part. It penalizes FY2023 and FY2024 heavily — those windows still carry the $3.6 billion Honey and $2.8 billion Paidy deals — but the penalty falls to $553 million in FY2025 as Honey rolls out of the window, and it is mechanically zero from FY2026, since PayPal made no material acquisitions in 2022, 2023, 2024, or 2025 [7]. One note on SBC: the figure used is the cash-flow-statement add-back embedded in operating cash flow ($1,002M in FY2025), not the equity-statement grant figure ($1,135M), because the adjustment must remove exactly what is already inside reported FCF.
The yield, three ways
Adjusted FCF Yield — FY2025
3-Year Average (FY23–25)
Ex Rolled-Off Acq Penalty
All three on today's $54.4 billion market cap ($56.15 × 968M shares, 24 Jul 2026). Current = FY2025 adjusted FCF $4,009M / $54,353M. Three-year average = mean FY2023–25 adjusted FCF ($3,243M) / $54,353M. Normalized removes only the lagging acquisition penalty (FCF − SBC = $4,562M). Source: derived from filed cash-flow statements [8]; market cap from fit_features.market_cap.
The current 7.4% and the three-year 6.0% differ because FY2023's adjusted FCF was depressed on both counts at once — peak SBC of $1,475 million and a peak acquisition penalty of $1,288 million — dragging the trailing average below the current run-rate. The FY2025 figure is the cleaner read of where the business sits now.
Set against its own history, the yield is a genuine jump. On a real-FCF basis (FCF − SBC, which extends cleanly across the full window), PayPal's yield on year-end market cap ran near 1.5% through the 2020–2021 bubble and has multiplied to roughly 8% today — driven almost entirely by an ~80% price collapse, not by cash-flow growth, since FY2025 real FCF of $4,562 million is barely above FY2020's $3,977 million.
Real-FCF yield = (reported FCF − SBC) / year-end market cap (year-end close × that year's shares). Derived from filed cash-flow statements and daily prices; a proxy for the baseline distribution, since the full acquisition-adjusted series exists only from FY2023. Source: company filings and price data, as reported [9].
The jump is real, but the fortress signature — a name that sat at a stable 3.5–4% and suddenly prints 8–9% on a scare — fits only in part. PayPal's pre-drawdown baseline was not a stable utility yield; it was a 1.5% growth multiple. The 3.5–4% band was passed through on the way down, not defended. The balance sheet and the direction match the pattern; the starting point does not.
Which bar applies
The balance-sheet class selects the reference line. PayPal carries $9,987 million of long-term debt and no short-term borrowings, against $8,049 million of cash, $2,373 million of short-term investments, and $4,330 million of long-term investments — $14,752 million of corporate cash and investments [10].
- Net debt: $9,987M − $14,752M = −$4,765M (net cash). Even on the narrowest measure — cash plus short-term investments only — the position is $10,422M against $9,987M of debt, still net cash.
- EBITDA: operating income $6,065M + depreciation and amortization $963M = $7,028M [11].
- Net debt / EBITDA: −$4,765M / $7,028M = −0.68×, which satisfies the fortress test (net debt ≤ 0).
The applicable reference line is therefore the fortress bar of 8–9%. On FY2025 adjusted FCF the yield is 7.4% — 62 bps short of the 8% low, 162 bps short of the 9% high. On the three-year average it is 6.0%, roughly 200 bps short of the low. On the normalized basis that removes the rolled-off acquisition penalty it is 8.4%, which clears the low end and sits 61 bps below the high.
7.4% on FY2025 adjusted FCF against the 8–9% fortress bar — 62 bps short at the low, 162 bps short at the high. Strip only the lagging acquisition penalty, which is mechanically zero from FY2026, and the same figure is 8.4%, inside the band.
Normalization
PayPal is not meaningfully cyclical. Payment volume tracks e-commerce and consumer spending, which grow through the cycle; the drawdown here is competitive and share-driven — branded-checkout pressure and margin compression on unbranded processing — not a cyclical trough in volumes. A mid-cycle volume-and-margin normalization is not the right lens, and forcing one would invent a swing the history does not show. Revenue rose every year of the window, from $17.8 billion in 2019 to $33.2 billion in 2025 [5].
The normalization that does apply is mechanical, not cyclical. The framework's five-year acquisition average is a lagging penalty: it charges FY2025 for deals closed in 2020 and 2021, even though acquisition spend has been zero since. Because 2022 through 2025 acquisitions were all zero, the trailing average is $553 million in FY2025 and falls to exactly $0 in FY2026. Removing that rolled-off penalty — the only assumption is that PayPal does not resume large M&A, consistent with four straight years of restraint — lifts adjusted FCF from $4,009 million to $4,562 million (FCF − SBC), and the yield from 7.4% to 8.4%. A skeptic who expects PayPal to return to $2–3 billion of annual acquisitions would keep the penalty and hold the yield near 7.4%; that is the alternate to recompute under.
The consensus check
Consensus forward free cash flow is drawn from S&P Capital IQ consensus free cash flow (mean), vintage 25 Jul 2026 — the closest vendor proxy for FCF, and the metric named in fit_features.consensus_forward_yield. It is not adjusted for SBC, and it runs richer than PayPal's reported definition: the CapIQ FY2025 mean of $6,561 million sits about $1.0 billion above the company's reported $5,564 million, most likely because CapIQ normalizes out the ~$1.3 billion swing in loans-held-for-sale that depressed reported operating cash flow in 2025.
Unadjusted = CapIQ consensus FCF mean / $54,353M market cap. Adjusted proxy = CapIQ FCF − ~$1,000M SBC run-rate, / market cap. Source: S&P Capital IQ consensus estimates (vintage 25 Jul 2026), fit_features.consensus_forward_yield; SBC run-rate from filed cash-flow statements [12].
Unadjusted, consensus FCF clears the fortress bar comfortably — 10.7% rising to 12.0% across FY2026–FY2028 on today's price. On Ruchir's basis, the SBC haircut of roughly $1.0 billion brings the proxy back to 8.9% in FY2026, 9.7% in FY2027, and 10.1% in FY2028 — clearing the 8–9% fortress band and reaching toward the 10% moderate bar. The read the framework points to: the sell side already models the cash flow that clears the bar; the buy side is discounting it out of fear. The counter-fact inside that read is the definitional gap — CapIQ's FCF runs ~$1 billion above what PayPal reports, so a translation that trusts the company's stricter definition would knock roughly a further point off, pushing the FY2026 adjusted proxy back toward 7.9%, right at the threshold rather than clearly above it.
The forward path, stated as arithmetic a skeptic can recompute: on today's market cap, FY2025 adjusted FCF yields 7.4%; the acquisition penalty is mechanically $0 from FY2026 (2022–2025 acquisitions were all zero), which alone lifts the same-price yield to 8.4%; consensus holds forward FCF flat-to-up ($5.8–6.5 billion FY2026–28). The probability the adjusted FCF yield clears the 8% fortress low within one to three years, on today's price, is roughly 65% — the mechanism is the rolled-off acquisition penalty plus a stable-to-lower SBC, not a demanded margin recovery. What consensus would have to concede for that not to happen: reported FCF falling below about $5.5 billion (a break from the FY2024–25 trend) or SBC re-inflating well above $1 billion. The path does not require growth; it requires the cash flow that is already there to hold.
FCF/revenue trend
Conversion of revenue into cash is stable-to-choppy, not deteriorating — which removes the usual objection that a high FCF yield is being manufactured by a shrinking business.
Reported FCF / revenue and (FCF − SBC) / revenue. Derived from filed income and cash-flow statements, FY2019–FY2025. Source: FY2025 10-K [5] [13].
Real-FCF conversion has oscillated in a 13–18% band across the seven years, with FY2023 (9.2%) the trough — a year dented by restructuring and peak SBC — and FY2024 (17.4%) the peak. FY2025 sits at 13.8%, right on the seven-year average. There is no downward trend to undercut the durability case: the cash margin is holding while revenue grows, which is what the year-10 test asks of it. The read across this tab: PayPal narrowly misses the fortress bar on trailing mechanical adjusted FCF, and clears its low end on the normalized and consensus-forward basis — a name at the doorstep of the bar rather than comfortably through it. How that squares with what the market is pricing is taken up in the Dislocation and Damage Math tabs; the durability of this conversion is examined in Durability.
Durability — the year-10 question
The one pure gate: will year-10 revenue and year-10 adjusted free cash flow be higher than today, with very high conviction? Revenue clears easily — PayPal has grown net revenues every year for a decade, to $33.2 billion, and consensus sees roughly $40 billion by 2029 [1]. The cash-flow leg does not clear as cleanly: the cash comes disproportionately from branded checkout, the exact product Apple Pay, Shop Pay and click-to-pay are attacking, and transaction revenue already grows at less than half the pace of payment volume [2]. That is a genuine doubt, and the gate is binary about doubt.
The conviction sources, graded for PayPal
Ruchir's year-10 conviction is supposed to come from five specific places. For PayPal, most apply only partly. The scale is real; the protection around it is thinner than the framework wants.
Sources: FY2025 10-K, Business — two-sided network and scale [3]; competition [4]; incorporation and eBay separation [5].
Market structure — partial. PayPal is a genuinely scaled operator: a two-sided network of 439 million active accounts across roughly 200 markets, processing $1.79 trillion of payment volume in 2025 [6]. But scale is not structure. PayPal's own filing calls the industry "highly competitive, dynamic, and innovative" and names competitors that are "larger than we are, have larger customer bases, greater brand recognition, longer operating histories" [7]. This is an oligopoly with weak pricing discipline, not a monopoly or a stable duopoly — the market-structure lattice built in the Business tab is the same one that leaves share contestable here.
Regulatory entry barriers — weak. Payments licensing (money transmission, PayPal's Luxembourg banking subsidiary, network membership) does raise the floor against a garage startup. But the framework's logic — the regulator does not let a newcomer take share — does not hold when the challengers are Apple, Alphabet, Visa, Mastercard and the largest banks. Regulation here is more often a cost and a two-way risk (interchange caps, network fee changes) than a moat [8].
Capital intensity — does not apply. PayPal is asset-light. There is no replacement-cost wall; the defensible asset is the installed base of consumer accounts and merchant acceptance. Network effects are real, but a network reachable through software is contestable by another piece of software — Apple Pay ships pre-installed on every iPhone.
Essentialness — partial. For a merchant, the PayPal button lifts checkout conversion; for a consumer, the stored balance, buyer protection and Venmo P2P have pull. Neither is irreplaceable — a merchant that drops PayPal loses some conversion but keeps selling. On the resilience test the record is reassuring: volume and revenue grew straight through the 2020 downturn.
Operating history — partial. The PayPal service has run since the late 1990s and survived the dot-com collapse, but as an independent public company it dates only to its January 2015 incorporation and July 2015 separation from eBay [9]. About a decade of standalone history, one full macro cycle navigated — short of the framework's 30-to-50-year ideal.
The structural threats, hunted
Execution is not a moat, so the question is what could take year-10 cash flow structurally lower regardless of how well management runs the business. A real search finds one named, quantifiable threat, plus a related pricing pressure already visible in the numbers.
Branded-checkout disintermediation — the named threat
PayPal's cash flows lean on branded checkout — the high-take-rate product where the consumer chooses "Pay with PayPal." That is precisely the product Apple Pay (embedded in iOS and Safari), Google Wallet, Shopify's Shop Pay and the card networks' click-to-pay are built to intercept. PayPal's 10-K lists the field plainly: "digital wallets and mobile payments solutions, credit, installment or other buy now, pay later methods… NFC based solutions, and Quick Response ('QR') code based solutions" [10]. This is the "your margin is my opportunity" case in its clearest form: Apple monetizes the device and can subsidize checkout toward zero take-rate to keep users inside its wallet — an economic attack PayPal cannot match on price.
The erosion is not hypothetical; it is already in the mix. In 2025 total payment volume rose 7% but transaction revenues rose only 3%, and the number of payment transactions actually fell 4%, with transactions per active account down to 57.7 from 60.6 [11]. Management attributes the wedge to "changes in product mix, merchant mix" [12] — volume shifting toward low-take-rate unbranded processing (Braintree), where PayPal competes with Adyen and Stripe on price, and away from high-margin branded checkout.
Source: FY2025 10-K, Key Metrics and Transaction revenues — TPV +7%, transaction revenues +3%, transactions -4%, transactions per account 57.7 vs 60.6 [13].
The year-10 arithmetic of this threat: even if branded share keeps ceding, total volume and revenue can still rise — Braintree volume, Venmo monetization and credit-product revenue (other value-added services grew 14% in 2025 [14]) carry the top line. But transaction-margin dollars — the cash that actually funds FCF — grow with take-rate, not volume. A decade of the 2025 pattern (volume +7%, transaction revenue +3%) compounds into revenue meaningfully higher and margin dollars roughly flat. That is the mechanism by which the revenue leg of the gate passes and the FCF leg does not.
Secondary threats
Regulatory reversal (two-way). Interchange caps and network-fee changes could compress the economics of branded card programs; the same licensing that is a mild moat is also a compliance cost and a source of fines risk [15].
Customer concentration — not a threat. No single customer accounted for more than 10% of net revenues in any of 2023-2025 [16]. Revenue is diversified across hundreds of millions of accounts; this conviction-cutter does not apply.
Technology / agentic commerce. AI shopping agents could re-route checkout entirely — both a threat (bypass the button) and an opportunity (PayPal is building agentic-checkout rails). Genuinely uncertain, and stated as such rather than resolved.
The disqualifier check
The framework's hard disqualifier is revenue declining high-single-digit for three consecutive fiscal years after a long existence. PayPal fails it in the other direction: revenue has risen every year on record.
Sources: net revenues, FY2025 Annual Report, Results of Operations (2023–2025) [17]; FY2022 Annual Report, Results of Operations (2020–2022) [18]; earlier years from the reported financials.
The feature file records the flag directly: revenue_trajectory.three_year_hsd_decline = false and consecutive_decline_years = 0. What the chart does show is a clean deceleration — from ~20% growth in 2016-2021 to 4.3% in 2025 — but decelerating growth is not decline. On the structural-decline question (X3): checked and absent at the top line. The softening is a mix-and-take-rate story inside a still-growing business, not a shrinking one.
The year-10 case, both ways
The strongest case that both are higher. Digital payments is a secular grower and PayPal is a scaled, profitable participant in it; consensus carries revenue from $33.2 billion to roughly $39.8 billion by 2029, and forward FCF sits in a $5.2–6.5 billion band, essentially flat-to-up on today's $5.6 billion [19]. The balance sheet is net-cash (see Self-Help) and capital intensity is low, so cash converts well. And the share count is falling ~4% a year, so per-share FCF rises even if the total merely holds.
Sources: FY2025 net revenues actuals from the Annual Report [20]; FY2026–FY2029 from consensus estimates (fit_features.consensus_forward_yield, data/sp/estimates.json).
The strongest doubt. The FCF leg leans on a product under a structural, well-capitalized attack. Branded checkout is where the take-rate — and therefore the cash — lives, and Apple, Google, Shop Pay and click-to-pay are purpose-built to intercept it; the 2025 numbers already show volume growing more than twice as fast as transaction revenue, with transactions per account falling [21]. The consensus flat-FCF line already embeds some of this; the doubt is whether a full decade of share erosion pushes transaction-margin dollars below today's level even as revenue climbs. That the current turnaround may execute well is beside the point — execution is not year-10 protection.
The read, once. Year-10 revenue higher clears with high conviction. Year-10 adjusted FCF higher does not clear with very high conviction: there is a genuine, named doubt — branded-checkout margin erosion — supported by PayPal's own take-rate disclosures, not by hand-waving. Under the framework's binary construction, that proper doubt means the year-10 gate does not hold cleanly. This is not a structural-decline verdict (the top line is still growing and the disqualifier flag is false); it is a durability-of-the-margin-mix doubt, and the gate turns on whether branded checkout holds its take-rate through the next decade. What would resolve it upward: transaction revenue re-converging toward TPV growth, and branded-checkout share stabilizing across several years.
FCF consistency (P2)
The rolling five-year average adjusted-FCF series is not_computable in the feature file — stock-based compensation is missing for every fiscal year 2016-2025, so adjusted FCF (FCF − SBC − 5-year-average acquisitions) cannot be built (recorded in the data gaps). What is available is reported free cash flow, and on that basis consistency is a clear strength.
Source: reported free cash flow, fit_features.adjusted_fcf.series (derived from company filings); rolling averages computed across FY2016–FY2025. Adjusted FCF is not shown because the SBC input is unavailable.
Annual FCF is volatile — $1.9 billion in 2017, $6.8 billion in 2024 — but the rolling five-year average is remarkably steady and rising: $3.5 billion (through 2020) to $5.3 billion (through 2025), with zero negative years in the record. That is the pattern the framework wants: bumpy year-to-year, predictable on a smoothed basis. There is no 5-to-8-year underwriting-cycle negativity here (PayPal is not an insurer or a bank taking underwriting losses); the volatility is timing of working capital and loan-portfolio movements, not a business-model loss cycle. The one caveat is the SBC adjustment: PayPal's stock compensation is material, and until it is subtracted the adjusted consistency picture — which the Yield tab owns — is one input short.
What sits behind the cash flow
Two facts frame how the durability doubt actually reaches shareholders. First, the buyback: shares outstanding fell from 1,218 million (2016) to 968 million (2025), a −4.0% five-year CAGR, with repurchases running about $6.0 billion a year [22]. That is why flat total FCF can still mean rising per-share FCF — the self-help mechanism examined in Self-Help. Second, the balance sheet is net-cash: cash and investments of roughly $14.8 billion against $10.0 billion of long-term debt at year-end 2025 [23]. Neither changes the year-10 gate — a buyback amplifies whatever the underlying FCF does, up or down — but both mean the business can comfortably outlast the competitive contest while it plays out.
Source: fit_features.share_count_trend (from data/financials/income.json); treasury-stock accumulation confirmed in the FY2025 10-K balance sheet [24].
PayPal can rescue its own holders. The balance sheet carries roughly $11.6 billion of debt against $12.8 billion of corporate cash and investments — net-cash-neutral, investment-grade, with no maturity above $1.5 billion in any year and a $5 billion undrawn revolver [1]. It has retired one share in five over ten years and guides roughly $6 billion of repurchases for 2026 — near a tenth of the $54 billion market cap. Management delivers on capital return; on multi-year growth targets it has a habit of setting and withdrawing them.
The balance sheet against the problem's duration
PayPal's payments business runs on customer funds — $38.2 billion of funds receivable and customer accounts sit on the balance sheet against an offsetting payable, and are not the company's money [2]. Stripped of that pass-through, the corporate capital structure is small and plain: about $10.9 billion of senior unsecured notes [3] plus a fully drawn ¥90 billion (~$575 million) Paidy revolving credit facility [4], against $12.8 billion of cash, cash equivalents, and investments available to the parent On management's own quarter-end framing the two lines were "$14.8 billion in cash, cash equivalents, and investments and $11.6 billion in debt" — a net-cash position however it is drawn [5].
The feature file could not class the balance sheet — its FY2025 debt and cash fields were absent, so balance_sheet_class reads unknown — but the filed numbers resolve it directly: net debt is roughly zero (≈ $11.6bn debt less $12.8bn cash) against EBITDA near $7 billion (FY2025 operating income $6,065M plus $963M depreciation and amortization). Net-debt-to-EBITDA is at or below zero, the fortress end of the framework's scale.
The maturity ladder is the point. No single year requires more than $1.5 billion, and the 2026 tower ($1,397M, a 2.65% note) is covered several times over by cash on hand:
Source: FY2025 Annual Report (Form 10-K), Note 12 — Future Principal Payments [6].
The notes carry effective rates between 1.65% and 5.66%, weighted low because the bulk was issued in the 2019–2022 low-rate window [7]. Refinancing risk is nominal: rolling the $1.4 billion 2026 maturity from 2.65% to roughly 5% adds about $33 million of annual interest against $6.4 billion of operating cash flow. The covenants are incurrence-only — limits on liens, sale-leasebacks, and mergers, with a change-of-control-plus-downgrade repurchase trigger — and there is no financial maintenance covenant that a bad year could breach [8]. Backstops sit behind the cash: an undrawn $5.0 billion revolver maturing June 2028 with a $2.0 billion accordion [9], a $5.0 billion commercial-paper program with only $200 million drawn, and roughly $80 million of uncommitted regional lines [10].
Nothing here forces capital allocation toward debt paydown. The maturities are self-funding from cash, the facilities are near-untouched, and repurchases can run at full pace through the drawdown without straining the credit.
The repurchase record — executed, not authorized
The buyback is a decade-long habit that has accelerated, not a fresh authorization. Cash actually spent on repurchases rose from about $1.0 billion in 2016 to $6.0 billion in each of 2024 and 2025:
Source: derived from company filings, cash-flow statements FY2016–FY2025; figures match fit_features.share_count_trend.buyback_cash_per_year. FY2025 detail in FY2025 10-K, Note 14 [11].
That spend has bought a real reduction in the count, not just an offset to dilution. Shares outstanding fell from 1,218 million in 2016 to 968 million in 2025 — down 20.5%, a five-year compound rate of −4.0% per fit_features.share_count_trend — and the pace steepened as the price fell, from 1,158M in 2022 to 968M in 2025:
Source: derived from company filings, FY2016–FY2025; figures match fit_features.share_count_trend.per_year.
This is the opposite of the framework's hard-fail. Stock-based compensation is not inflating the count away underneath the buyback — SBC expense has fallen from $1,530 million in 2023 to $1,293 million in 2024 to $1,084 million in 2025, so a rising share of each year's repurchase now retires float rather than mopping up grants [12].
Two facts sharpen the record. First, prices paid: PayPal repurchased at an average cost of $67.72 in 2023, $65.55 in 2024, and $69.94 in 2025 — every one above today's $56.15 [13]. At $56.15 the same $6 billion retires about 107 million shares versus the 86 million bought in 2025 — roughly a quarter more float per dollar. Second, authorization backs the intent: $13.9 billion remained under the February 2025 program at year-end, about 2.3 years of buyback at the current run-rate already board-approved and open-ended [14].
The count reduction already drives the reported line. In FY2025 net income rose 26% ($4,147M to $5,233M) while diluted EPS rose 35% ($3.99 to $5.41) [15] — the roughly nine-point wedge is the shrinking diluted share base, 1,039 million to 968 million [16]. The flywheel is turning before any help from growth.
Management's buyback intent, from the record
Management states the priority plainly and repeats it. On the Q4 FY2025 call the company reported it "completed $1.5 billion in share repurchases, bringing full-year repurchases to a total of $6 billion" and paid its first dividend [17]. The 2026 guide is explicit: "approximately $6 billion in share repurchases and at least $6 billion of adjusted free cash flow" [18], reiterated a quarter later [19]. Asked directly to weigh growth against capital return, CFO Jamie Miller framed it as continuity: "we've had a strong capital return profile over the last couple of years with a $6 billion buyback, the initiation of a dividend, and continuing that program into this year" [20].
The counter-fact sits inside the same commentary. Under new CEO Enrique Lores, 2026 carries roughly three points of transaction-margin headwind from targeted growth investment, and the company guides non-GAAP EPS "ranging from down low single digits to slightly positive" despite the $6 billion buyback [21]. So this year the reinvestment offsets much of the buyback's EPS accretion — the flywheel is intact but idling while the business is retooled. What it is not is a diversion to debt paydown; the repurchase line holds at $6 billion.
Insider behaviour adds no conviction to the intent. Across 2023–2026 there were only two open-market insider purchases of any kind — Dan Schulman's ~26,000-share buy at ~$76 in February 2023, before he left, and a small filing by CFO Jamie Miller — against dozens of routine sales, and no executive bought the −57% decline. Economic ownership is thin: PayPal is an eBay spin-off with no founder on the register, held overwhelmingly by index funds (Vanguard, BlackRock, Fidelity). The buyback is a corporate policy, not a bet the managers are making with their own money.
The levered exception
This exception does not apply, and does not need to. It is reserved for balance sheets carrying real leverage where only a ~25%-plus adjusted yield justifies the debt. PayPal is the reverse case — net-cash — and the yield is around 10–12% on consensus forward free cash flow, not 25%. The repurchase engine here rests on a fortress sheet and an ordinary-but-high yield, so the framework's standard capital-allocation test governs, not the levered carve-out.
The absurdity check
The feature file marks float_retirement_years as not_computable: adjusted free cash flow is unavailable because stock-based compensation was missing from the cash-flow feed, and float retirement requires it. The arithmetic can still be bounded from filed figures. At the $54.35 billion market cap, reported FY2025 free cash flow of $5.56 billion retires the entire float in about 9.8 years; the ~$6 billion 2026 guide implies about 9 years; and on a stricter adjusted basis — reported FCF less the $1.08 billion of 2025 SBC, roughly $4.5 billion — about 12 years.
Source: market cap and FCF per fit_features (market_cap.native, adjusted_fcf.series); SBC per FY2025 10-K, Note 15 [22].
Nine to twelve years is a full order of magnitude off the framework's ~3-year signature, where the price makes a claim it cannot survive. PayPal is cheap and self-funding, not priced at an absurdity; the buyback compounds meaningfully, but the setup is a high-yield workhorse, not the extreme.
Dividend safety
The dividend is not part of the return case. PayPal only initiated one in October 2025, at $0.14 per quarter (~$130 million) [23]. Annualized at $0.56, that is a ~1.0% yield at $56.15 and roughly $540 million against $5.56 billion of free cash flow — a ~10% payout, trivially covered, and immaterial to the thesis either way.
Management credibility
The credibility record splits cleanly, and both halves matter. On capital return, management does exactly what it says: $6 billion of buyback delivered in each of the last two years, a 20% share-count reduction over five, a dividend initiated on schedule. On multi-year growth narratives, the pattern is serial over-promise and quiet withdrawal, across two CEOs:
- The 750 million active-accounts by 2025 aspiration, set at the February 2021 investor day, was retracted a year later: "we no longer believe that the 750 million medium-term account aspiration we set last year is appropriate" [24]. Monthly active accounts today sit near 225–231 million, never on that path.
- The account-growth framework was then abandoned outright the following year: "we will no longer guide net new active accounts" (Q4 FY2022) [25].
- Alex Chriss's investor-day multi-year growth outlook, presented in early 2025, was withdrawn within a year: "we are no longer providing the specific multi-year growth outlook we presented at our Investor Day a year ago… Neither [a stable e-commerce environment nor the assumed pace of adoption] has materialized" [26].
Around that runs unusual leadership turnover: three CEOs in roughly two and a half years — Schulman to Chriss in September 2023 to Lores by the Q1 FY2026 call, his first [27] — which implies the Chriss turnaround disappointed the board enough to change again.
This is a caution, not the framework's promotional-CEO exclusion. PayPal's near-term guidance is broadly met rather than serially sandbagged and re-hit (Q4 FY2025 EPS missed the low end by only $0.04), the tone is operational rather than flamboyant, and the one promise the self-help case turns on — the buyback — is kept literally. What the record counsels is discounting management's forward growth vision heavily while trusting its capital-return execution. The read would change if the $6 billion repurchase line were cut to fund the transformation, or if the share count inflected upward.
What this establishes
PayPal has both the balance sheet and the demonstrated habit to lean into repurchases through the dislocation: net-cash, laddered maturities, no covenant that bites, and a decade of executed buybacks that have already shrunk the count a fifth and are guided to continue near a tenth of the market cap in 2026. The reservations are that 2026's growth reinvestment mutes the EPS accretion for a year, the float-retirement math is a moderate 9–12 years rather than an absurdity, and management's growth promises carry a poor delivery record even as its capital-return promises are kept. The related question of whether the earnings damage is temporary or permanent is taken up in Damage Math; the yield computation itself sits in Yield.
The re-rating levers are dated and already turning: $6.0 billion of stock retired in 2025 with $13.9 billion still authorized, branded-checkout volume growth up to 2% from 1%, and a new CEO with a $1.5 billion cost program — first tested at the Q2 print on 28 July 2026. This name routinely round-trips 34–57% drawdowns to a prior local high in 12–15 months; a repeat is within reach by late-2027, and consensus's own EPS growth returns in FY2027. Long-dated options exist; 30-day IV sits at 47%.
What would close the gap
Four mechanisms are visible in the record, each with a date or a printed number behind it rather than a hope that sentiment turns.
The denominator is shrinking fast, and the fuel is committed. PayPal repurchased approximately $6.0 billion of stock in 2025, and as of 31 December 2025 roughly $13.9 billion remained authorized under programs approved in June 2022 and February 2025 [1]. The Q1 FY2026 quarter added another $1.5 billion, taking the trailing-twelve-month total to $6.0 billion, against $13.5 billion of cash and investments and $11.6 billion of debt [2]. Against the $54.4 billion market capitalization, a $6.0 billion annual pace retires roughly 11% of the shares each year, and the remaining authorization alone equals about 26% of the equity. Share count has already fallen from 1,039 million (FY2024) to 968 million (FY2025) — a 6.8% reduction in one year — and the five-year share-count CAGR is −4.0%. This is the cleanest lever: it needs no macro help, only continued execution, and it compounds every quarter EPS holds.
Source: derived from FY2025 10-K capital-return disclosure and the deterministic feature file (share-count trend, market cap) [3].
Guidance is resetting against a bar the company keeps clearing. Estimates were cut hard over the trailing 180 days — FY2028 normalized EPS down about 15% and revenue about 8% — but over the last 90 days both have barely moved, so the cutting cycle has paused rather than reversed (see CapIQ). Against that lowered bar the print record is strong: Q1 FY2026 EPS beat by 5.6% and revenue by 3.7%, the latest in a run of mostly high-single to double-digit EPS beats since mid-2024. Management reaffirmed full-year 2026 guidance on the Q1 call and said Q1 EPS "benefited from stronger transaction margin dollar growth" [4]. A low, stabilizing bar that the company beats is the ordinary machinery of a re-rating.
The feared event — branded-checkout decline — is not, so far, happening. The narrative that drove the drawdown was that PayPal's core checkout was being disrupted. In Q1 FY2026 branded-checkout total payment volume grew 2% on a currency-neutral basis, up from 1% the prior quarter, and transaction-margin dollars ex-interest grew 3% [5]. Two percent is not acceleration to be proud of, but it is stabilization at the exact metric the bears price for terminal decline. Each quarter that growth holds or ticks up chips at the disruption thesis.
New management arrived with a quantified cost program. Enrique Lores took over as CEO — he is the named CEO on the Q1 FY2026 call [6] — after the board replaced Alex Chriss effective 1 March 2026 over the Q4 FY2025 branded-checkout stumble (per PaymentsSource/Payments Dive reporting, March 2026). Management guided to "at least $1.5 billion of gross run-rate savings over the next two to three years" from removing duplicate structure and accelerating automation [7]. A leadership reset plus a dated savings target is the classic self-help lever; the risk is that a reset year front-loads investment and delays the payoff. This ties to the operating levers detailed in Self-Help.
The near-term calendar node is fixed: Q2 FY2026 reports 28 July 2026, with consensus at roughly $1.28 EPS on $8.47 billion of revenue — the first read on whether branded-checkout stabilization and the cost program are holding.
Base rates from this name's own history
PayPal has only traded since its July 2015 spin-off, so the history is short — but violent. The chart below is the arc since the 2021 top.
Source: run price feed, month-end closes from data/prices/daily.json (as reported).
The all-time peak was $308.53 on 23 July 2021. From there the stock fell roughly 87% to its $39.08 trough on 12 February 2026 and now trades at $56.15 — down about 82% from the 2021 high. That top-to-current decline is the deepest and longest in the name's history and has no round-trip precedent: a recovery to the 2021 bubble peak is not a base-rate expectation on any horizon this tab reasons over. The base rates that matter are the recurring, tradeable drawdown-and-recovery cycles below that peak.
Source: derived from run price feed, 25% zigzag pivots on data/prices/daily.json (as reported); the current episode's peak, trough and depth match the feature-file capitulation gauge.
The pattern is consistent: outside the 2021 bubble unwind, PayPal has produced four drawdowns of 34–57% since 2022, each followed by a 29–82% rally. The most instructive precedent is 2023: a 33.5% fall to a $50.39 trough in October 2023 — below where the stock trades today — was followed by an 82% climb to $91.81 over roughly 15 months. The current episode, −57.4% over 391 days (peak 17 January 2025 to trough 12 February 2026, per the capitulation gauge), is the deepest of the four; the +43.7% rally off the trough to date is mid-pack in speed. The drawdown anatomy is dissected in Dislocation.
The 18-month test
A recovery to a prior local high — the $78–92 band the stock held in 2024–early-2025, roughly +40% to +64% from $56.15 — within 18–24 months is consistent with both this name's own base rates and consensus timing: the 2023 episode delivered +82% in about 15 months, and the levers above (buyback retiring ~11% of shares a year, a beat-able bar, stabilizing checkout, a $1.5 billion cost program) are already in motion. What would falsify this read is the mechanism failing to fire — branded-checkout currency-neutral TPV growth rolling back toward flat or negative and transaction-margin-dollar growth stalling, which would return the name to the disruption narrative and reset the clock in years rather than quarters. That falsifier is the pivot in the Fit ledger. A round-trip to the 2021 peak is not part of this test and not a reasonable 18-month expectation.
What consensus expects, and when
The sell side has capitulated rather than led. Across 33 price-target contributors the mean is $53.07 and the median is $50.00 — below the $56.15 last price — with a lone $147 high pulling the mean up and a $32 low anchoring the bottom (see CapIQ). The recommendation mix is 6 Buy, 2 Outperform, 32 Hold, 0 Underperform, 3 Sell across 43 analysts, a consensus score of 2.81 — squarely Hold. The Street is not positioned ahead of a re-rating; a majority sits at Hold with targets at or under the current quote, which is where capitulation, not enthusiasm, leaves coverage.
Source: S&P Capital IQ consensus via Xpressfeed, as of 25 July 2026 (as reported); cross-referenced in CapIQ.
As for when the recovery shows up in printed numbers: consensus itself models FY2026 as a pause — normalized EPS roughly flat at about $5.31, essentially FY2025's level — then EPS growth returning in FY2027 to about $5.75, up roughly 8%. The candidate quarter for the re-rating to appear in earnings is therefore the FY2027 series, with the first genuine year-over-year EPS re-acceleration visible around Q1 FY2027 (reporting spring 2027), well inside the 18-month window. The nearer test is the 28 July 2026 Q2 print, where the market will judge whether the FY2026 pause is holding to plan.
Instrument facts
Long-dated listed options on PYPL exist: as of July 2026 the option chain carries expiries out to 21 January 2028, roughly 18 months forward, so contracts with a 12-month-plus horizon — the framework's minimum, with 18-month-plus preferred — are available. PYPL is a large, actively traded single-name option underlying with continuous weekly and LEAPS listings; a precise open-interest figure could not be pulled from a citable, dated source because the aggregator pages bot-wall automated access, so it is stated here only at that qualitative level.
Implied volatility is not elevated. AlphaQuery reports PYPL's 30-day implied volatility (mean) at 0.4725 — about 47% — for 24 July 2026, below the ~50–55 level the framework treats as acceptable and well under the 60–70 elevated band; Fintel's snapshot the same week shows a 30-day IV near 52 against a 52-week range of roughly 27–56, consistent with a market pricing normal, not crisis-level, movement. These are stated as facts as of their dated sources; nothing here is a recommendation, and no strike, expiry, or position is suggested.
Because long-dated options do exist and IV is not elevated, this name is not routed to the watchlist on instrument grounds — the framework's watchlist consequence applies only when such instruments are absent, which is not the case here.